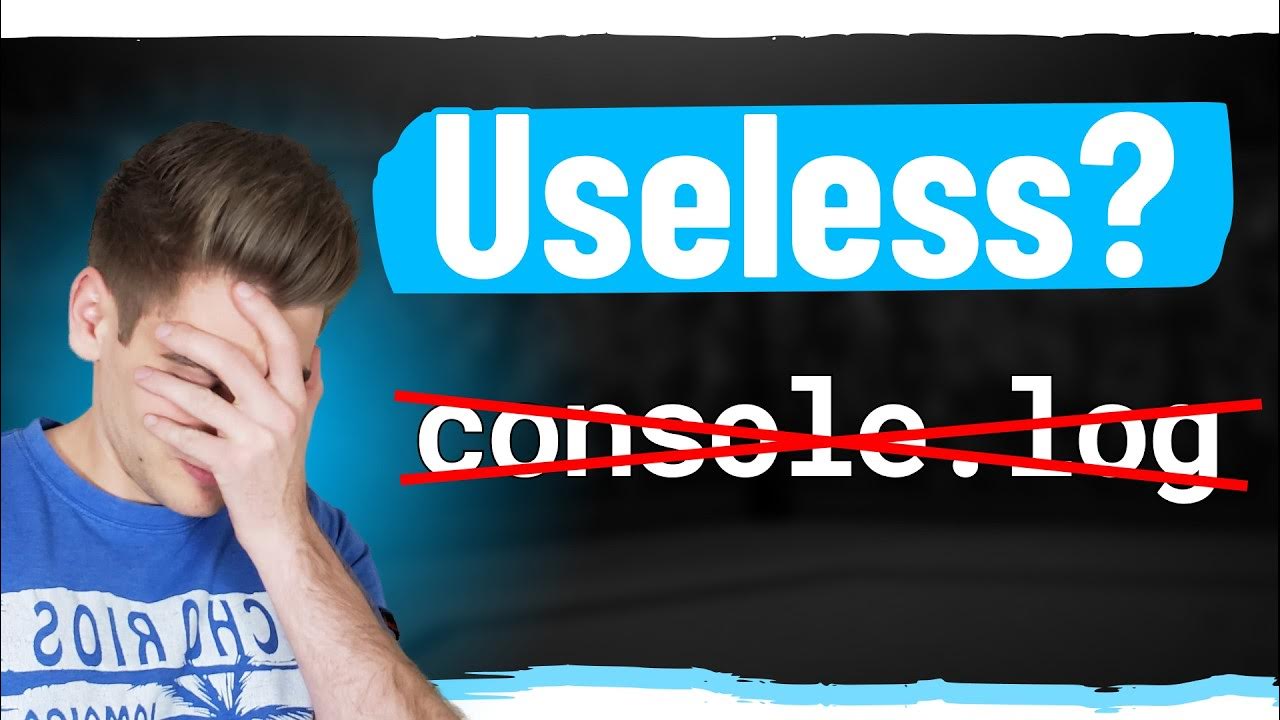
Debugging JavaScript - Are you doing it wrong?

freeCodeCamp.org
1 Nov 201804:13

Summary

TLDRThis video script introduces a more efficient debugging method for JavaScript, replacing the traditional scattering of console.log statements. It demonstrates using the 'debugger' keyword in code, which creates breakpoints allowing developers to pause execution, inspect variables, and navigate through the code step-by-step. The tutorial uses a React app as an example, but the technique is applicable to any frontend JavaScript. By utilizing breakpoints, developers can quickly identify and fix issues, leading to a more professional and hassle-free debugging process.

Takeaways

  • 🔍 The script discusses a common frustration with debugging JavaScript by using scattered console.log statements.
  • 🛠️ The video introduces a better debugging method for frontend JavaScript, applicable regardless of the framework used.
  • 💻 The example provided is a broken React app from the 'Learn React and Redux' course, but the debugging method is not framework-specific.
  • 🔄 The usual approach of adding console.log to inspect variables is acknowledged but criticized for being cumbersome.
  • 🚀 The 'debugger' keyword is introduced as a replacement for console.log, which provides a more interactive debugging experience.
  • 🔎 When the 'debugger' statement is hit, the browser's JavaScript execution pauses, allowing for an inspection of the current state.
  • 📐 The script explains how to use the browser's developer tools to navigate through the code, inspect variables, and understand the call stack.
  • 📌 Breakpoints can be set, viewed, and managed directly within the developer tools for more control over the debugging process.
  • 👀 The debugger allows developers to see the exact line of code where an issue occurs, streamlining the process of identifying and fixing bugs.
  • 🛑 The use of the debugger statement is temporary and should be removed from the code once the issue is resolved.
  • 🌟 The video concludes by emphasizing that using breakpoints is a more professional, faster, and hassle-free way to debug JavaScript code.

Q & A

  • What is the common issue faced when debugging JavaScript using console.log statements?

    -The common issue is that it can be messy and frustrating to constantly add and remove console.log statements throughout the code to check for errors.

  • What is the main project featured in the video script?

    -The main project is a React app from the 'Learn React and Redux from Beginner to Paid Professional' course.

  • What problem does the app face in the script?

    -The app has a problem where the thumbnails do not display correctly when performing a search.

  • What is the alternative method suggested in the script for debugging JavaScript?

    -The alternative method suggested is using the 'debugger' statement instead of console.log to pause the JavaScript execution at a specific point for inspection.

  • Why is using the 'debugger' statement considered a better way to debug JavaScript?

    -Using the 'debugger' statement allows for a more interactive debugging experience, where developers can inspect the current state of the code, see variable values, and navigate through the code without the need for constant logging.

  • What happens when the JavaScript execution hits the 'debugger' statement?

    -When the JavaScript execution hits the 'debugger' statement, the browser stops the execution at that point, creating a breakpoint where developers can inspect the code and its current state.

  • What can developers see in the browser's developer tools when at a breakpoint?

    -Developers can see the current state of the code, variable values, the call stack, variable scopes, and the ability to add new breakpoints or step through the code line by line.

  • How can developers navigate through the code using breakpoints?

    -Developers can navigate through the code by stepping into functions using the down arrow or stepping through the code one line at a time using the right-facing arrow.

  • What is the process for fixing a problem identified during a debugging session with breakpoints?

    -After identifying the problem and the exact line of code causing the issue, developers can go back to their code, make the necessary corrections, and then remove the 'debugger' statement.

  • Why is removing the 'debugger' statement important after fixing the issue?

    -Removing the 'debugger' statement is important to ensure that the code runs smoothly without interruption in a production environment, as it is only meant for debugging purposes.

  • How does using breakpoints compare to the traditional console.log method in terms of efficiency?

    -Using breakpoints is more efficient as it allows for a more structured and less intrusive way to debug code, providing immediate insights into the code's state without the need for multiple console logs.

Outlines

00:00

🛠️ Improving JavaScript Debugging with Breakpoints

The paragraph introduces a common frustration developers face when debugging JavaScript by using console.log statements scattered throughout the code. It presents a web app from a React and Redux course as an example of a broken application, where search results are not displaying correctly. The speaker proposes a more efficient debugging method by using the 'debugger' keyword instead of console.log, which allows the browser to pause execution at a specific point, creating a breakpoint. This method enables developers to inspect the current state of the code, examine variable values, and navigate through the call stack and variable scopes, providing a clearer path to identifying and fixing issues.

Mindmap

Keywords

💡JavaScript

JavaScript is a high-level, interpreted programming language commonly used for enhancing web pages with interactive elements. In the video, it is the main focus as the speaker discusses debugging JavaScript code, which is essential for fixing issues in web applications.

💡Console.log

Console.log is a JavaScript function used to output information to the web browser's console. It is often used for debugging purposes, as mentioned in the script where developers scatter it throughout their code to check variable values or program flow.

💡Debugging

Debugging refers to the process of finding and resolving defects or problems in a computer program. The video script emphasizes a better debugging method for JavaScript, illustrating the transition from using console.log to using breakpoints for a more efficient approach.

💡React

React is a popular JavaScript library for building user interfaces, particularly single-page applications. The script mentions a React app as an example, showing that the debugging techniques discussed are applicable to modern web development frameworks.

💡Breakpoints

Breakpoints are markers in the source code that tell the debugger to pause the execution of the program at a specific point. The video demonstrates how to use breakpoints for a more interactive and precise debugging experience, rather than just printing logs to the console.

💡Developer Tools

Developer Tools are built into most web browsers and provide various features for debugging and developing web pages. The script instructs the viewer to use these tools to take advantage of JavaScript debugging features like breakpoints.

💡Call Stack

The Call Stack is a mechanism used by JavaScript to keep track of function calls and their return addresses. In the video, the call stack is used to show the sequence of function calls leading up to the current breakpoint, helping developers understand the flow of execution.

💡Variable Scope

Variable Scope refers to the context within a program where a variable is accessible. The script explains how, during a breakpoint, one can inspect the current variable scopes and their values, which is crucial for understanding the state of the program.

💡Stepping

Stepping is a debugging technique where the execution of the program is advanced one line or statement at a time. The video describes how to use stepping to go through the code line by line, which helps in understanding the logic and identifying issues.

💡Object

In JavaScript, an object is a data structure that can hold properties and methods. The script mentions an issue where a variable was expected to be a string but was actually an object, highlighting the importance of understanding data types during debugging.

💡URL Property

The URL property is a common attribute within an object that holds a string representing a web address. In the context of the video, the URL property is the correct value needed to resolve the issue, demonstrating the importance of correctly identifying and accessing object properties.

Highlights

JavaScript debugging can be frustrating with scattered console.logs.

A better way to debug JavaScript is introduced in the video.

The example is from a React app, but the method works for any frontend JavaScript.

The app has a search issue where thumbnails are broken.

Traditional debugging involves adding console.log to inspect variables.

The debugger keyword is a cleaner alternative to console.log for debugging.

Using debugger pauses JavaScript execution at a breakpoint for inspection.

Developer tools must be open to utilize the debugger statement.

The debugger allows inspection of the current state of the code.

Variables' current values can be seen by hovering over them in the debugger.

The call stack shows all functions called to reach the current point in code.

Variable scopes and their values are visible in the debugger.

New breakpoints can be added and existing ones removed in the debugger interface.

Stepping through code allows for detailed examination of function calls.

The debugger identifies the exact line of code causing an issue.

Fixing the code involves adjusting the property access to resolve the issue.

After fixing, the app functions correctly, demonstrating the effectiveness of breakpoints.

Breakpoints offer a professional, faster, and hassle-free debugging method.

Transcripts

play00:00

whenever your javascript doesn't work

play00:02

you probably resort to scattering

play00:04

console.logs around your code and

play00:06

checking the console but this can be a

play00:08

messy and frustrating way to debug your

play00:11

javascript in this video i'm going to

play00:13

teach you a better way

play00:18

so i have this web app here it's

play00:21

actually the main project from my learn

play00:23

react and redux from beginner to paid

play00:26

professional course so it's a react app

play00:28

but that's completely irrelevant

play00:30

what i'm going to show you will work for

play00:32

any frontend javascript whether you're

play00:34

using a framework or not

play00:37

anyway this app is broken if we do a

play00:39

search the thumbnails all come back

play00:42

broken

play00:43

so what do we do so most people will do

play00:46

this

play00:47

they'll go to the part of the code where

play00:49

we've got the function that processes

play00:51

the search results and do a console.log

play00:53

on the results

play00:56

then go back to the browser

play00:58

and reload it

play01:02

then you want to bring up the console

play01:04

and we want to check the results that

play01:06

we've outputted

play01:17

and yeah they all look fine to us so the

play01:20

next step is usually to add another

play01:22

console.log somewhere else

play01:24

now this way of debugging does work but

play01:27

it is a bit cumbersome constantly adding

play01:29

and removing console.logs all over the

play01:31

place

play01:33

i'm going to show you a slightly nicer

play01:35

way

play01:37

in the code we simply remove the

play01:39

console.log

play01:41

and in its place we put the word

play01:43

debugger

play01:44

now let's go back to the browser and see

play01:46

what that does

play01:48

so we reload in the browser and you're

play01:51

going to need to make sure the developer

play01:53

tools are open all this won't work at

play01:55

all

play01:56

we perform our search again

play02:00

now when the code hits the debugger

play02:02

statement the browser stops the

play02:04

javascript execution is paused at this

play02:07

point we call this a breakpoint we can

play02:10

now do some really cool things

play02:13

we can inspect the current state of the

play02:15

code

play02:16

we can see exactly where we are in the

play02:18

code we can mouse over variables and it

play02:20

shows their current values

play02:24

if you go down here we can see a call

play02:26

stack showing all of the functions that

play02:28

were called to get to this point

play02:31

over here we can see all of the variable

play02:34

scopes we've got available at the

play02:35

current point and see all of the

play02:36

variables in each scope and even their

play02:39

current values

play02:42

we can even add new breakpoints by

play02:44

clicking like this and a blue arrow

play02:46

comes up then we press the blue arrow

play02:48

down here and this moves on to the next

play02:51

break point or just to the end of the

play02:53

code if there isn't one and you can just

play02:55

remove the breakpoint by clicking it

play02:57

again

play02:59

you can press this down arrow here to

play03:01

skip into functions or this right facing

play03:05

arrow here to step through the code one

play03:08

line at a time

play03:11

so this goes into another function call

play03:18

and somewhere down here

play03:20

we've got the valley we want we thought

play03:22

it was a string and this is why we've

play03:24

got a problem but it's actually an

play03:25

object and we want the url property

play03:28

which is a string

play03:32

and the debugger gives us the exact line

play03:34

of code we need to go and fix it so we

play03:37

go back to our code we know the exact

play03:39

line number where we've got the problem

play03:41

because we saw it in the debugger and

play03:43

now we just fix it by adding dot url

play03:47

and of course we go down and we remove

play03:49

the debugger statement

play03:52

so in the browser again we reload

play03:56

perform another search

play03:58

and now we get all our thumbnails

play04:00

everything works as expected so there

play04:03

you have it

play04:04

breakpoints are a more professional

play04:06

faster and hassle-free way to debug your

play04:09

javascript code

Rate This

5.0 / 5 (0 votes)

Etiquetas Relacionadas
JavaScriptDebuggingReactReduxWeb DevelopmentBreakpointsConsole LogsCode InspectionDeveloper ToolsPerformance Optimization
¿Necesitas un resumen en inglés?