Perkenalan Microsoft Excel
Summary
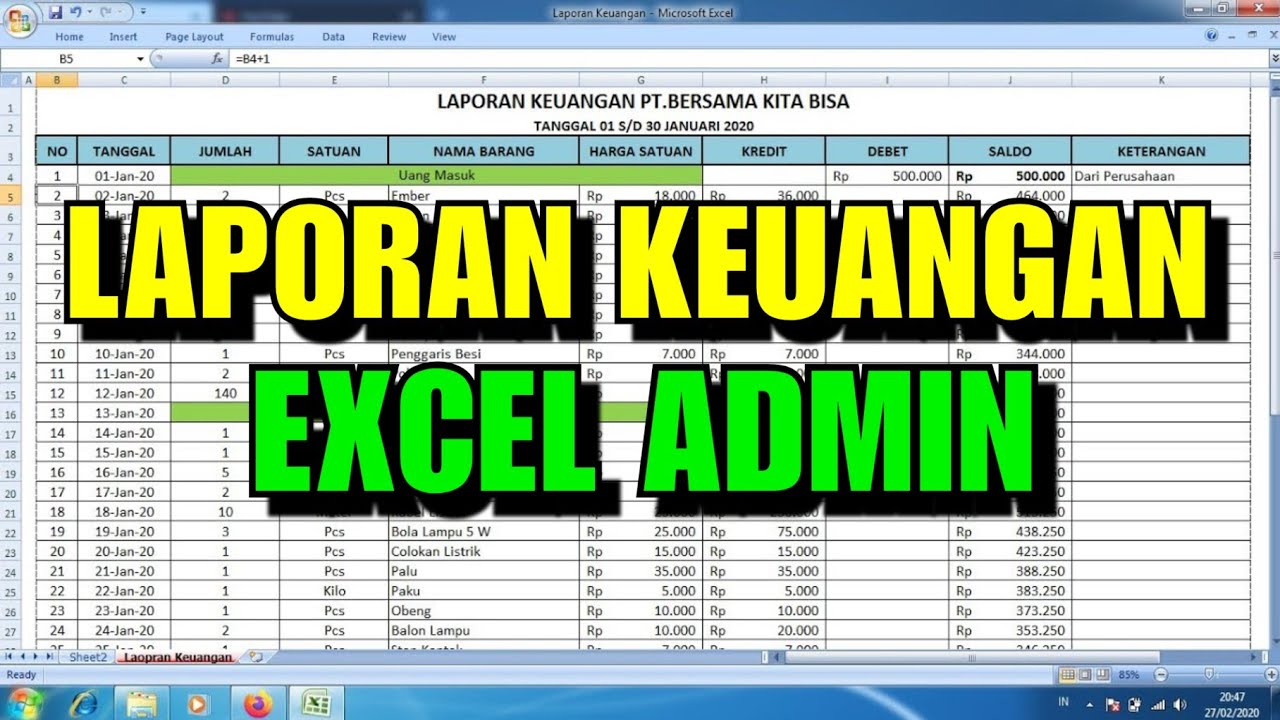
TLDRIn this tutorial, the instructor introduces the basics of Microsoft Excel, focusing on creating a monthly expenses report. The video covers how to set up a blank workbook, input data, categorize expenses, and use features like conditional formatting, sorting, and filtering to organize the information. It also demonstrates how to create charts and tables, as well as techniques for handling large datasets, such as using cell addresses to track errors. This is a hands-on guide aimed at improving users' ability to manage and analyze their financial data effectively using Excel.
Takeaways
- 😀 Make sure you have Microsoft Excel installed before starting the data cleaning process.
- 😀 Excel offers various templates like Monthly Company Budget and Attendance Report for different purposes.
- 😀 The basic structure of Excel includes cells, sheets, and workbooks. Cells are where data is entered, and sheets are individual pages within a workbook.
- 😀 To input data for a monthly expense report, start by listing items such as food, bills, and miscellaneous expenses.
- 😀 Categorize the expenses, for example, food items like burgers and ramen are categorized as 'food', while utilities like electricity and water are categorized under 'utilities'.
- 😀 You can insert new columns, such as for categories, by selecting and clicking 'Insert'.
- 😀 Adding new sheets in Excel can be done by clicking the plus sign on the bottom of the workbook.
- 😀 Excel allows formatting options like headers, background colors, and conditional formatting to highlight data like overspending.
- 😀 Conditional formatting lets you highlight cells that meet certain criteria, such as values over 100 being highlighted in red.
- 😀 Sorting and filtering data helps analyze the largest or smallest expenses and view specific categories of interest.
- 😀 You can merge cells to create headers or combine data like expenses and income into a single row for better clarity and presentation.
Q & A
What is the first step before starting to work with Microsoft Excel according to the video?
-The first step is to ensure that Microsoft Excel is installed on your computer. Once installed, you can open it and begin working.
What is the difference between a workbook and a sheet in Excel?
-A workbook is the entire Excel file that can contain multiple sheets, while a sheet (or worksheet) is a single page within the workbook where you enter and manage data.
How are rows and columns identified in Excel?
-Rows are identified by numbers along the left side, and columns are identified by letters along the top of the sheet.
How can you categorize expenses in Excel according to the video?
-You can categorize expenses by adding a column for 'Category' and assigning each expense to a category, such as 'Food' for burger and ramen, or 'Utilities' for electricity and water.
What is the purpose of adding a date column in an expense report?
-Adding a date column helps track when each expense occurred, allowing you to see on which dates the largest spending happened.
What feature can you use in Excel to automatically highlight values exceeding a certain threshold?
-You can use Conditional Formatting. For example, you can highlight all cells in the 'Amount' column that exceed 100 by setting a 'Greater Than' rule.
How do you remove conditional formatting if you no longer want to use it?
-To remove conditional formatting, select the relevant cells, go to Conditional Formatting, and choose 'Clear Rules from Selected Cells'.
How can you sort expenses from largest to smallest in Excel?
-Select the column containing the expense amounts and use the 'Sort from Largest to Smallest' option to organize the data accordingly.
What is the purpose of using filters in an Excel expense report?
-Filters allow you to display only the data you want to see, such as expenses from a specific category, making it easier to analyze subsets of your data.
What does the 'Merge and Center' feature do in Excel?
-Merge and Center combines multiple cells into one and centers the content, which is useful for creating titles or summarizing tables like 'Income' or 'Expenses'.
How can charts be created from expense data in Excel?
-Select the relevant columns, such as 'Item Name' and 'Amount', then go to the Insert menu and choose a chart type, like a bar chart, to visually display the data.
What is a practical way to quickly locate an error in a large Excel dataset?
-You can enter the cell number in the 'Name Box' (cell address) to quickly navigate to that specific cell, which helps in checking for mistakes or unusual values.
Outlines

Esta sección está disponible solo para usuarios con suscripción. Por favor, mejora tu plan para acceder a esta parte.
Mejorar ahoraMindmap

Esta sección está disponible solo para usuarios con suscripción. Por favor, mejora tu plan para acceder a esta parte.
Mejorar ahoraKeywords

Esta sección está disponible solo para usuarios con suscripción. Por favor, mejora tu plan para acceder a esta parte.
Mejorar ahoraHighlights

Esta sección está disponible solo para usuarios con suscripción. Por favor, mejora tu plan para acceder a esta parte.
Mejorar ahoraTranscripts

Esta sección está disponible solo para usuarios con suscripción. Por favor, mejora tu plan para acceder a esta parte.
Mejorar ahoraVer Más Videos Relacionados
Cara membuat Laporan Keuangan di Excel dengan Cepat

22. Literasi Digital - Memasukkan dan Mengedit Data - Informatika Kelas X
Workplace Productivity Tools Part 3

Como Aprender Excel do ZERO [GUIA ATUALIZADO]

Como Criar Planilhas no Excel para Iniciantes

Aula 01 - Word Avançado - Informática Avançada - Prof. Thiago Bianeck
5.0 / 5 (0 votes)
