Correlation Interpret Numeric
Summary
TLDRThis video explores the concept of correlation, focusing on how it's represented by a numerical value known as the R score or correlation coefficient. The R value indicates the strength of the relationship between two variables, where a perfect correlation is represented by 1 or -1. The video explains that the direction of the correlation (positive or negative) isn’t as important as the magnitude of the number. As the R value approaches zero, the correlation weakens. The video also introduces a scale to interpret these values and discusses potential final exam questions on the topic.
Takeaways
- 😀 Correlation between two variables can be represented by both a number and a graph.
- 😀 The number used to represent correlation strength is called the 'R value' or 'correlation coefficient.'
- 😀 The R score simply indicates how strong the correlation is between variables, not whether it's positive or negative.
- 😀 The exact value of the R score doesn't matter as much as its magnitude; a larger number indicates a stronger correlation.
- 😀 Perfect correlation occurs when the R score is either +1 or -1, which corresponds to points forming a perfect straight line on a scatter plot.
- 😀 Whether the correlation is positive or negative does not affect its strength, only its direction.
- 😀 As the R score approaches 0, the correlation weakens, and points on a scatter plot become further apart.
- 😀 A perfect correlation means that all data points are perfectly aligned in a straight line on the graph.
- 😀 The scale of the R score helps us understand the strength of the correlation; the closer it is to 1 or -1, the stronger the correlation.
- 😀 The closer the R score is to 0, the weaker the correlation is, with points on the scatter plot becoming more dispersed.
Q & A
What does an R value or R score represent in correlation?
-An R value, or correlation coefficient, represents the strength of the correlation between two variables. It indicates how closely the variables are related.
How is correlation represented besides using an R value?
-Correlation can also be represented graphically on a scatter plot, where the relationship between two variables is shown by the positioning of the data points.
What is the significance of the R score being either 1 or -1?
-An R score of 1 or -1 indicates a perfect correlation. This means the data points on a scatter plot are perfectly aligned in a straight line, with no variation from the trend.
Is there a difference between a correlation of 1 and a correlation of -1?
-No, there is no difference in strength between a correlation of 1 and a correlation of -1. Both represent a perfect correlation, but one is positive and the other is negative.
What does an R value close to 0 indicate?
-An R value close to 0 indicates a very weak correlation between the two variables. The points on the scatter plot will be scattered and not closely aligned.
How does the direction of the correlation (positive or negative) affect the strength of the relationship?
-The direction of the correlation (positive or negative) does not affect the strength of the relationship. The strength is determined by how close the data points are to a straight line, not whether the correlation is upward or downward.
What is the relationship between correlation strength and the R score's magnitude?
-The magnitude of the R score (how far it is from 0) represents the strength of the correlation. A value closer to 1 or -1 means a stronger correlation, while values near 0 represent weaker correlations.
Can a positive R score and a negative R score represent the same strength of correlation?
-Yes, a positive R score and a negative R score can represent the same strength of correlation, as long as the absolute value of the R score is the same. The sign simply indicates the direction of the relationship.
What happens to the data points on a scatter plot as the correlation weakens?
-As the correlation weakens, the data points on the scatter plot become more scattered, moving further apart from each other, and the trend becomes less clear.
What might be a potential exam question based on this topic?
-A possible exam question could ask you to interpret an R value and determine the strength of the correlation, or to analyze a scatter plot and describe the correlation based on the positioning of the data points.
Outlines

Esta sección está disponible solo para usuarios con suscripción. Por favor, mejora tu plan para acceder a esta parte.
Mejorar ahoraMindmap

Esta sección está disponible solo para usuarios con suscripción. Por favor, mejora tu plan para acceder a esta parte.
Mejorar ahoraKeywords

Esta sección está disponible solo para usuarios con suscripción. Por favor, mejora tu plan para acceder a esta parte.
Mejorar ahoraHighlights

Esta sección está disponible solo para usuarios con suscripción. Por favor, mejora tu plan para acceder a esta parte.
Mejorar ahoraTranscripts

Esta sección está disponible solo para usuarios con suscripción. Por favor, mejora tu plan para acceder a esta parte.
Mejorar ahoraVer Más Videos Relacionados
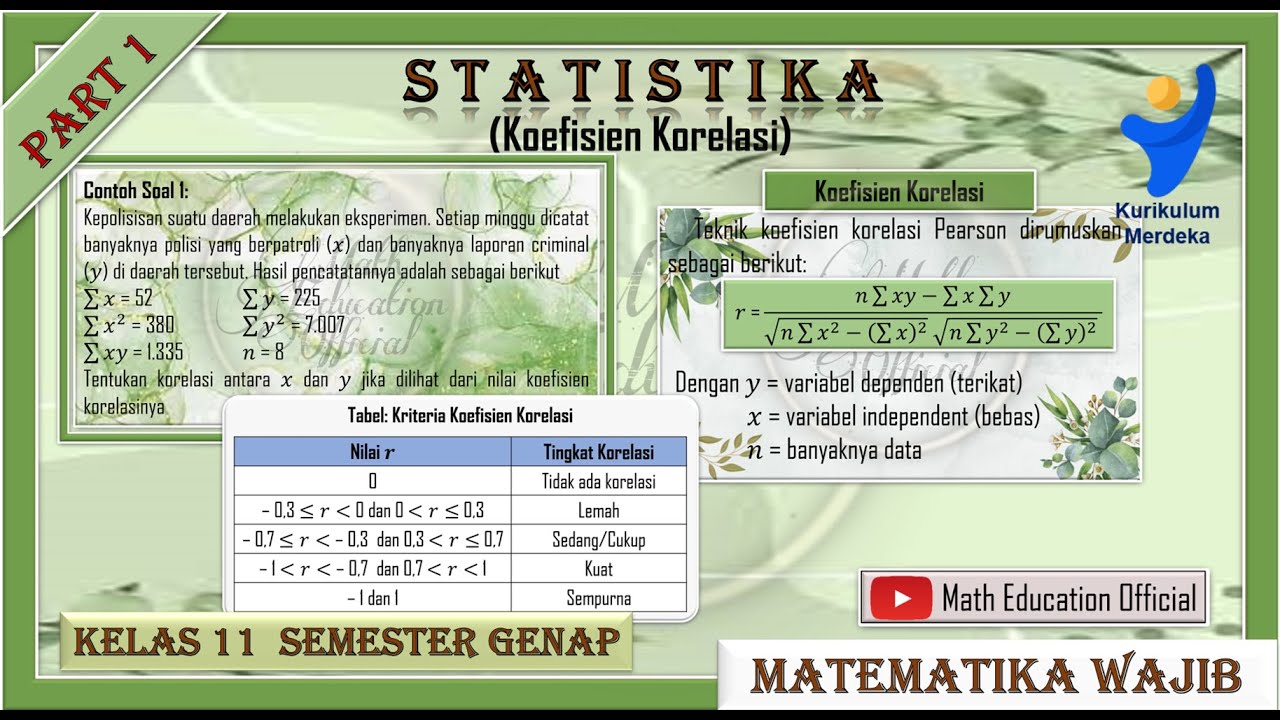
(PART 1) Koefisien Korelasi
Korelasi Product Moment (r) Hal 110-116 Bab 3 STATISTIK Kelas 11 SMA Kurikulum Merdeka

Korelasi Pearson - Matematika Wajib SMA Kelas XI Kurikulum Merdeka

Statistik Teori pertemuan ke ~ 9 Korelasi dan Regresi

Calculate (Estimate) Correlation

APA ARTI NILAI KOEFISIEN KORELASI (r) PADA REGRESI LINIER BERGANDA ? | #StudyWithTika
5.0 / 5 (0 votes)
