APA ARTI NILAI KOEFISIEN KORELASI (r) PADA REGRESI LINIER BERGANDA ? | #StudyWithTika
Summary
TLDRIn this video, Rizki Atika introduces the concept of correlation coefficient, explaining its role in measuring the strength of the linear relationship between two variables. The value of the correlation coefficient (r) ranges from -1 to +1, with values close to 0 indicating a weak relationship and values near 1 suggesting a strong one. Positive values indicate a direct relationship, while negative values indicate an inverse relationship. The video emphasizes the importance of logical reasoning when interpreting these values, cautioning against misinterpretations, and concludes with a teaser for the next topic on coefficient of determination.
Takeaways
- 😀 Koefisien korelasi (correlation coefficient) shows the strength of a linear relationship between two variables.
- 😀 The correlation coefficient, denoted as 'r', ranges from -1 to +1, with values close to 0 indicating weak relationships.
- 😀 A value of 'r' close to +1 indicates a strong positive relationship, while a value close to -1 indicates a strong negative relationship.
- 😀 Positive correlation means that as one variable increases, the other increases as well.
- 😀 Negative correlation means that as one variable increases, the other decreases.
- 😀 Logical thinking is crucial when interpreting correlation, as some relationships may seem statistically strong but not make sense logically.
- 😀 A strong correlation coefficient doesn't necessarily mean there is a meaningful relationship between the variables if the data doesn't make sense.
- 😀 For example, a negative correlation between workload and performance makes sense, where increasing workload leads to decreased performance.
- 😀 Correlation should not be interpreted as causation. Just because two variables are correlated doesn't mean one causes the other.
- 😀 When analyzing real-world data, it’s important to question whether the correlation makes logical sense before drawing conclusions.
- 😀 In the next video, the topic will shift to the coefficient of determination, which is related to the square of the correlation coefficient.
Q & A
What is the correlation coefficient (r) and what does it indicate?
-The correlation coefficient (r) measures the strength and direction of the linear relationship between two variables. It ranges from -1 to +1. A value close to 0 indicates a weak relationship, while values near +1 or -1 indicate stronger relationships.
What does a positive r value indicate in terms of the relationship between variables?
-A positive r value indicates a direct or positive correlation between the variables. As one variable increases, the other tends to increase as well.
What does a negative r value indicate in terms of the relationship between variables?
-A negative r value indicates an inverse or negative correlation. As one variable increases, the other tends to decrease.
Why is it important to consider logical reasoning when analyzing correlation coefficients?
-It is crucial to apply logical reasoning when interpreting correlation coefficients because even strong correlations may not always make sense in real-world contexts. For example, a high correlation between unemployment rates and KFC sales in a specific area may not logically imply a causal relationship.
What should one do if the correlation coefficient value is strong but lacks logical sense?
-If the correlation coefficient is strong but lacks logical sense, it is essential to question the validity of the relationship. A correlation that doesn't align with reality may be a spurious correlation and should be treated with skepticism.
What example does the script provide to explain a negative correlation?
-The script provides the example of workload and performance. It explains that as workload increases, performance tends to decrease, showing a negative correlation between the two variables.
What is the range of values that the correlation coefficient (r) can take?
-The correlation coefficient (r) can range from -1 to +1, where -1 indicates a perfect negative correlation, +1 indicates a perfect positive correlation, and 0 indicates no correlation.
How is the relationship between variables interpreted if the correlation coefficient (r) is close to 1?
-If the correlation coefficient (r) is close to 1, it suggests a strong positive linear relationship between the two variables. As one variable increases, the other variable also increases significantly.
What happens if the correlation coefficient (r) is close to 0?
-If the correlation coefficient (r) is close to 0, it indicates a very weak or no linear relationship between the two variables. Changes in one variable do not predict changes in the other.
What concept is introduced after the discussion on the correlation coefficient in the video?
-After discussing the correlation coefficient, the video introduces the concept of the coefficient of determination (r²), which is related to the correlation coefficient and represents the proportion of variance in the dependent variable that can be explained by the independent variable.
Outlines

This section is available to paid users only. Please upgrade to access this part.
Upgrade NowMindmap

This section is available to paid users only. Please upgrade to access this part.
Upgrade NowKeywords

This section is available to paid users only. Please upgrade to access this part.
Upgrade NowHighlights

This section is available to paid users only. Please upgrade to access this part.
Upgrade NowTranscripts

This section is available to paid users only. Please upgrade to access this part.
Upgrade NowBrowse More Related Video
STATISTICA parte 2.3 : correlazione e regressione

Statistik Teori pertemuan ke ~ 9 Korelasi dan Regresi

Korelasi Product Moment (r) Hal 110-116 Bab 3 STATISTIK Kelas 11 SMA Kurikulum Merdeka

APA ITU KOEFISIEN DETERMINASI (r²) ? | CONTOH DAN PEMBAHASAN PADA OUTPUT SPSS #StudyWithTika
[Mathematics in the Modern World] Correlation & Simple Linear Regression
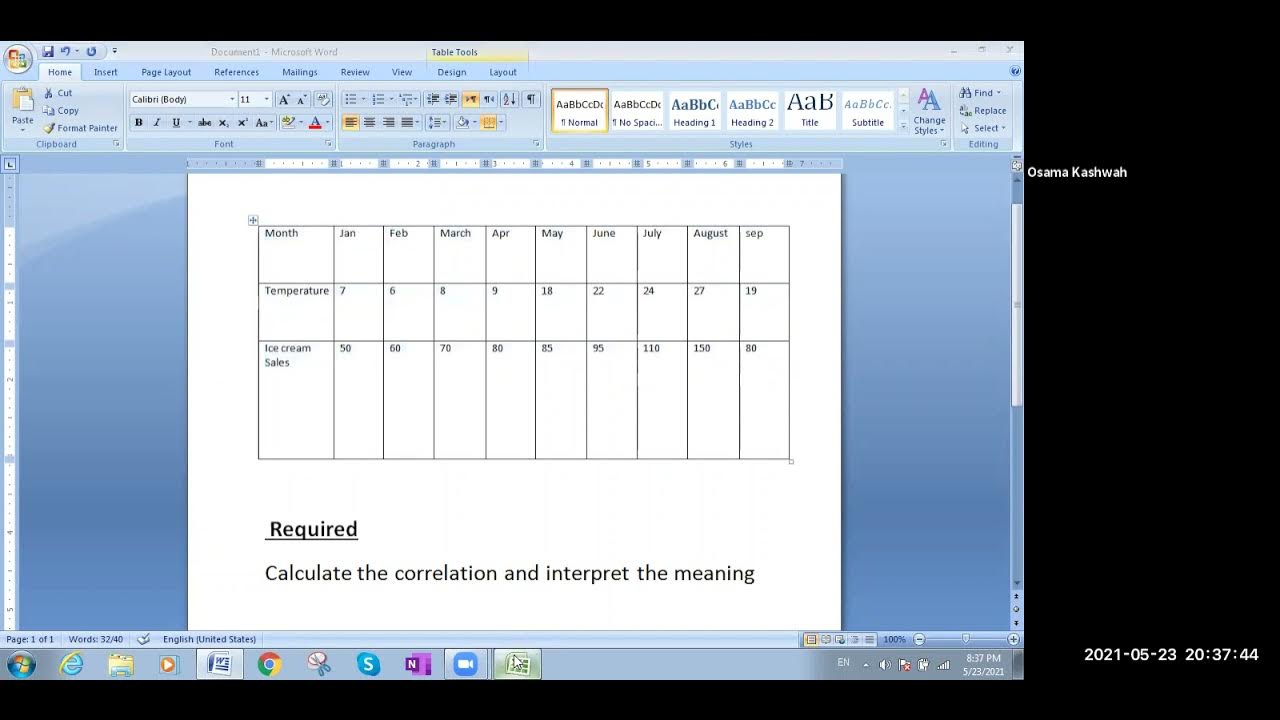
excel and correlation
5.0 / 5 (0 votes)