Calculate (Estimate) Correlation
Summary
TLDRIn this video, the presenter explains how to estimate the correlation coefficient, or the R value, which represents the strength of the relationship between two variables. Using a scatter plot graph, the presenter demonstrates how to draw a rectangle around the trend and measure its sides to estimate the correlation. The process includes choosing the correct sign (positive or negative) based on the graph's trend and plugging the measurements into a formula. The video also emphasizes the importance of careful measurement, identifying outliers, and understanding the significance of the correlation result.
Takeaways
- 😀 The correlation coefficient (R value) represents the strength of the correlation between two variables.
- 😀 The process of estimating the correlation coefficient involves analyzing a scatter plot graph.
- 😀 Start by drawing a rectangle around the points that form the trend in the scatter plot.
- 😀 The rectangle should be drawn as tightly as possible around the points to accurately reflect the trend.
- 😀 Measure the short and long sides of the rectangle. If they don’t match, average the measurements.
- 😀 The formula for the correlation coefficient requires choosing a positive or negative sign based on the slope of the trend.
- 😀 A positive slope means using the positive sign, while a negative slope means using the negative sign.
- 😀 The formula used involves subtracting the ratio of the short side to the long side from 1.
- 😀 After calculating the correlation coefficient, you can use a scale to determine the strength of the correlation.
- 😀 Be cautious of outliers, which are points that do not follow the general trend of the graph.
- 😀 Careful measurement and correct formula application are essential to obtain an accurate estimate of the correlation coefficient.
Q & A
What is the correlation coefficient?
-The correlation coefficient (R value) measures the strength and direction of the relationship between two variables. A positive value means a positive correlation (both variables increase together), while a negative value means a negative correlation (one variable increases, and the other decreases).
Why is the term 'estimating' used when calculating the correlation coefficient?
-The term 'estimating' is used because the method of finding the correlation coefficient involves some approximation, particularly when drawing the rectangle around the trend points on a scatter plot. This method is not perfect, but it provides a reasonable estimate.
What is the first step in estimating the correlation coefficient?
-The first step is to be given a scatter plot with data points. You will then draw a rectangle around the points that form the trend.
How do you draw a rectangle around the points on a scatter plot?
-Start by drawing one long side of the rectangle along the trend of the points. Then, draw the other long side parallel to the first one. Finally, close the rectangle by drawing short sides at 90-degree angles to the long sides, making sure the rectangle fits tightly around the trend.
What should you do if the short and long sides of the rectangle do not match up in length?
-If the short and long sides of the rectangle do not match, you should take the average (mean) of the two short sides and the average of the two long sides to get the appropriate measurements.
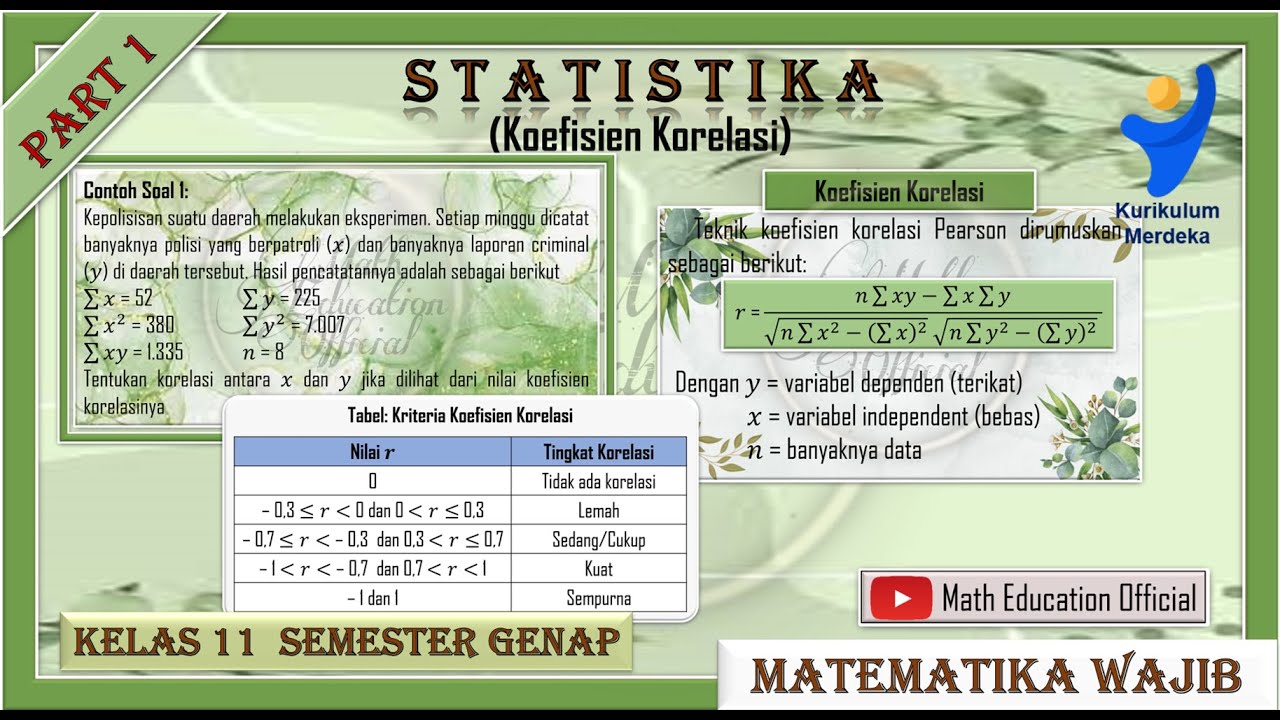
What is the formula for calculating the correlation coefficient?
-The formula for the correlation coefficient is: R = 1 - (short side / long side). The result will be positive or negative based on the direction of the trend (positive for an upward slope, negative for a downward slope).
How do you choose the sign (positive or negative) in the formula?
-The sign is chosen based on the direction of the trend in the scatter plot. If the trend slopes upwards, you choose a positive sign. If the trend slopes downwards, you choose a negative sign.
What is an outlier, and how does it affect the correlation coefficient calculation?
-An outlier is a data point that does not follow the general trend in the scatter plot. Outliers are easy to spot and can distort the accuracy of the estimated correlation coefficient, so it's important to consider their presence when drawing the rectangle and estimating the correlation.
What should you do to ensure accuracy when estimating the correlation coefficient?
-To ensure accuracy, draw the rectangle as tightly as possible around the trend points, measure the sides carefully, and apply the formula properly. Also, observe whether the trend is positive or negative to select the correct sign for the formula.
How do you interpret the result of the correlation coefficient?
-The result of the correlation coefficient (R value) will indicate the strength and direction of the correlation. A value close to +1 or -1 indicates a strong correlation, while a value near 0 indicates a weak correlation. A positive value indicates a positive correlation, and a negative value indicates a negative correlation.
Outlines

This section is available to paid users only. Please upgrade to access this part.
Upgrade NowMindmap

This section is available to paid users only. Please upgrade to access this part.
Upgrade NowKeywords

This section is available to paid users only. Please upgrade to access this part.
Upgrade NowHighlights

This section is available to paid users only. Please upgrade to access this part.
Upgrade NowTranscripts

This section is available to paid users only. Please upgrade to access this part.
Upgrade NowBrowse More Related Video

Correlation Interpret Numeric
Korelasi Product Moment (r) Hal 110-116 Bab 3 STATISTIK Kelas 11 SMA Kurikulum Merdeka

Statistik Teori pertemuan ke ~ 9 Korelasi dan Regresi
(PART 1) Koefisien Korelasi

Korelasi Pearson - Matematika Wajib SMA Kelas XI Kurikulum Merdeka

APA ARTI NILAI KOEFISIEN KORELASI (r) PADA REGRESI LINIER BERGANDA ? | #StudyWithTika
5.0 / 5 (0 votes)