Statistik Teori pertemuan ke ~ 9 Korelasi dan Regresi
Summary
TLDRThis video script explains the concepts of regression and correlation analysis, focusing on their application to study the relationship between two variables. It introduces simple linear regression, the role of independent and dependent variables, and the use of scatter diagrams to visualize data. The script also covers key concepts like the regression equation, correlation coefficient, and interpretation of statistical values, emphasizing their importance in understanding data patterns. By comparing the correlation coefficient with a reference value (R table), the script demonstrates how to assess the strength of relationships between variables, concluding with practical exercises for the viewers.
Takeaways
- 😀 Regression analysis is used to study and measure statistical relationships between variables.
- 😀 Simple regression involves two variables: the independent variable on the x-axis and the dependent variable on the y-axis.
- 😀 The goal of regression analysis is to find a regression equation that describes the relationship between variables.
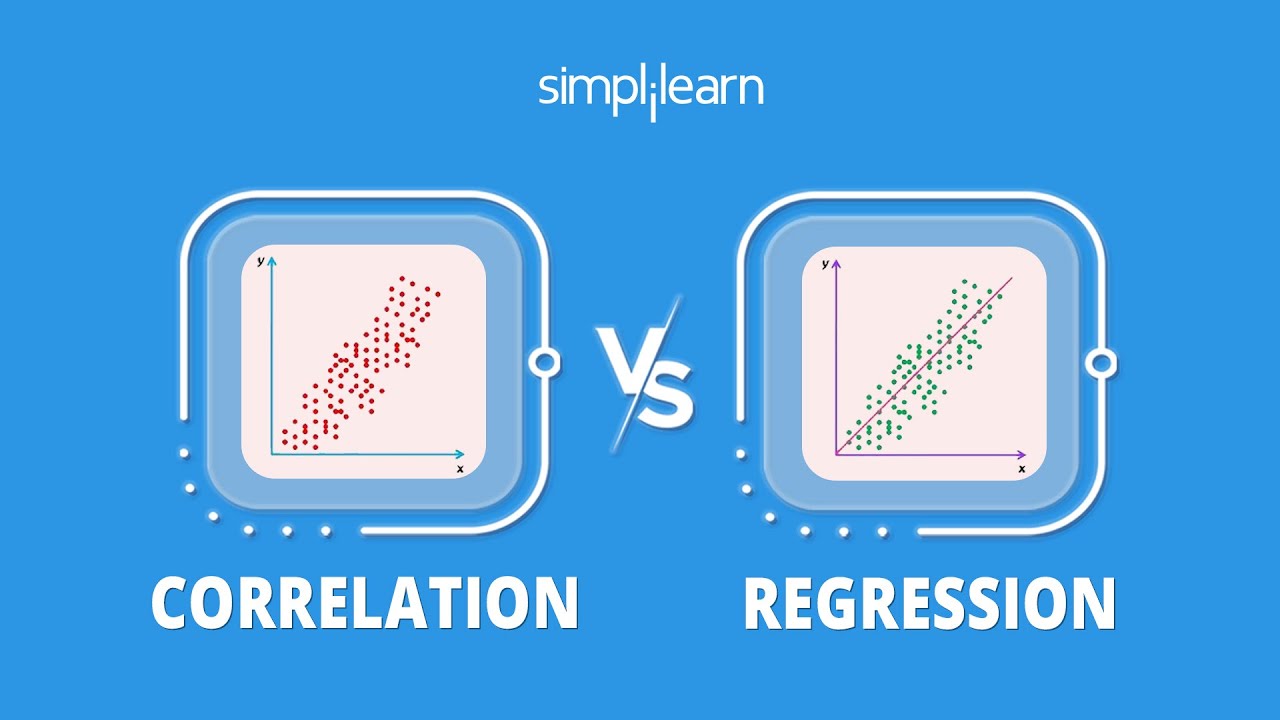
- 😀 Correlation analysis measures the strength and direction of the relationship between variables using a correlation coefficient.
- 😀 A high correlation coefficient (close to +1 or -1) indicates a strong relationship between the variables.
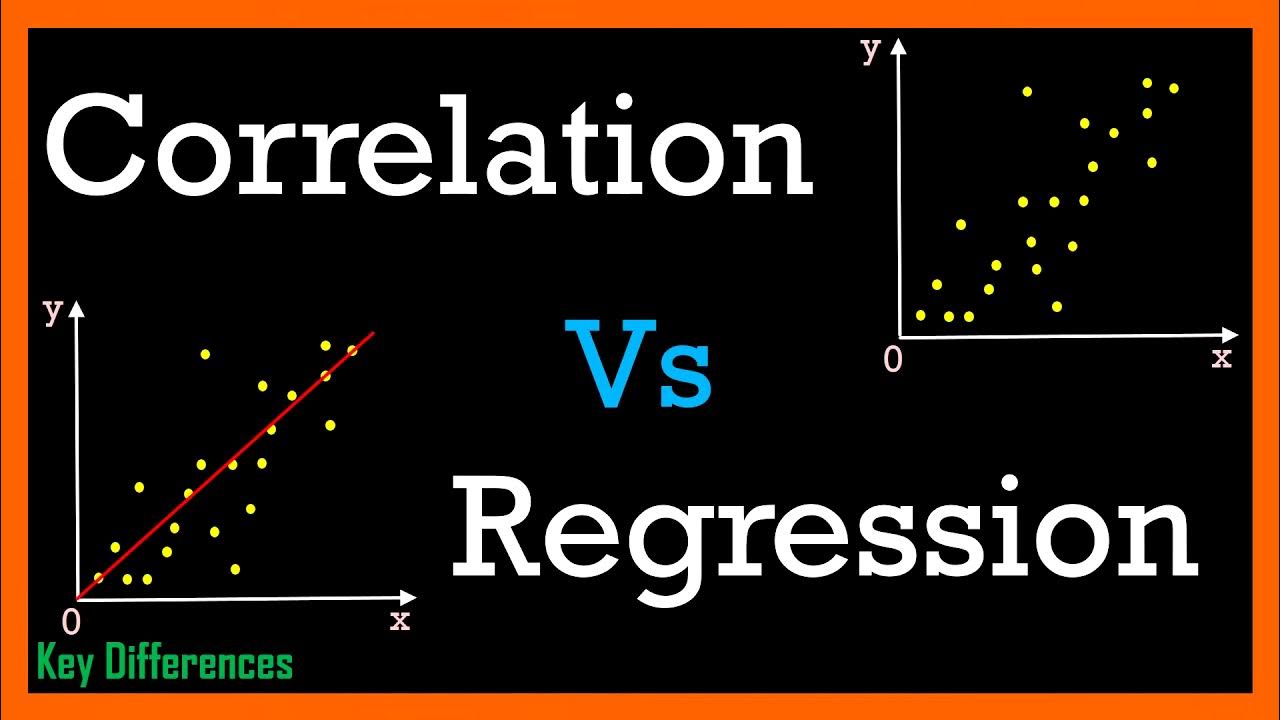
- 😀 A scatter diagram is used to plot data points and visualize the relationship between variables, helping in regression analysis.
- 😀 The dependent variable is plotted on the y-axis, and the independent variable is plotted on the x-axis.
- 😀 The regression line equation is expressed as y = a + bx, where 'a' is the intercept and 'b' is the slope of the line.
- 😀 The intercept ('a') represents the value of the dependent variable when the independent variable is zero.
- 😀 The slope ('b') indicates how much the dependent variable changes for each unit change in the independent variable.
- 😀 In practical examples like UV-Vis spectrophotometry, higher concentrations lead to higher absorbance values, showing a strong relationship between concentration and absorbance.
Q & A
What is the purpose of regression analysis?
-Regression analysis is used to study and measure the statistical relationship between two or more variables. It specifically helps in describing the pattern or function of the relationship between the independent and dependent variables.
How does simple regression differ from multiple regression?
-Simple regression analysis involves two variables: one independent variable (x) and one dependent variable (y). Multiple regression, on the other hand, involves more than two variables, typically to predict the value of the dependent variable based on multiple independent variables.
What is the role of the independent and dependent variables in regression analysis?
-The independent variable (on the x-axis) is assumed to influence or cause changes in the dependent variable (on the y-axis). The dependent variable is the one whose variation is being predicted or explained by the independent variable.
What does the regression equation y = a + bx represent?
-In the equation y = a + bx, 'y' is the dependent variable, 'x' is the independent variable, 'a' is the intercept (the value of y when x is zero), and 'b' is the slope, which represents the rate of change in y for each unit change in x.
What is the intercept in a regression equation and how is it interpreted?
-The intercept 'a' is the point where the regression line intersects the y-axis (when x = 0). It represents the average value of the dependent variable when the independent variable has no effect (i.e., when x equals zero). However, the intercept should only be interpreted meaningfully if the data includes values close to zero for x.
What is correlation analysis and how does it differ from regression analysis?
-Correlation analysis measures the strength and direction of the relationship between two variables, whereas regression analysis focuses on predicting the value of the dependent variable based on the independent variable. Correlation analysis uses the correlation coefficient to quantify the strength of the relationship.
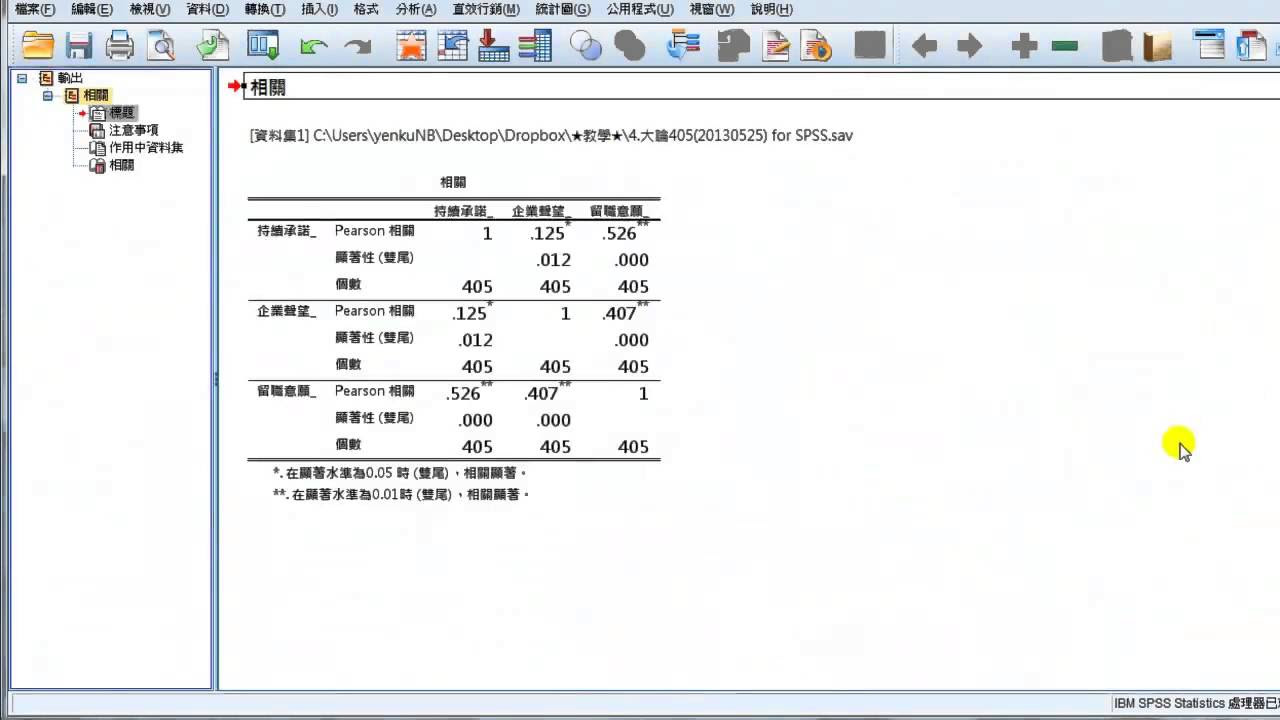
What is the significance of the correlation coefficient in statistical analysis?
-The correlation coefficient (r) quantifies the strength of the relationship between two variables. It ranges from -1 to 1, with values closer to 1 or -1 indicating a stronger relationship, while values closer to 0 suggest a weak or no relationship.
How can a scatter diagram help in regression and correlation analysis?
-A scatter diagram visually plots data points for two variables, helping to identify the pattern of their relationship. It assists in determining the type of regression model to use and provides insight into the strength and direction of the correlation between the variables.
What does an R-squared value of 0.9873 imply about the relationship between two variables?
-An R-squared value of 0.9873 implies that 98.73% of the variation in the dependent variable can be explained by the independent variable, indicating a very strong correlation between the two variables.
How do you determine the significance of a correlation using an R-table?
-To determine the significance of a correlation, you compare the calculated correlation coefficient (r) with a critical value from the R-table based on the degree of freedom and desired confidence level. If the calculated r is greater than the R-table value, the correlation is considered statistically significant.
Outlines

This section is available to paid users only. Please upgrade to access this part.
Upgrade NowMindmap

This section is available to paid users only. Please upgrade to access this part.
Upgrade NowKeywords

This section is available to paid users only. Please upgrade to access this part.
Upgrade NowHighlights

This section is available to paid users only. Please upgrade to access this part.
Upgrade NowTranscripts

This section is available to paid users only. Please upgrade to access this part.
Upgrade NowBrowse More Related Video

Regresi dan Korelasi Sederhana
Correlation vs Regression | Difference Between Correlation and Regression | Statistics | Simplilearn
一夜。統計學:相關分析
Correlation Vs Regression: Difference Between them with definition & Comparison Chart
Analisis Regresi Sederhana - Statistika Ekonomi dan Bisnis Lanjutan (Statistik 2) | E-Learning STA
REGRESSION AND CORRELATION EDDIE SEVA SEE
5.0 / 5 (0 votes)