[Mathematics in the Modern World] Correlation & Simple Linear Regression
Summary
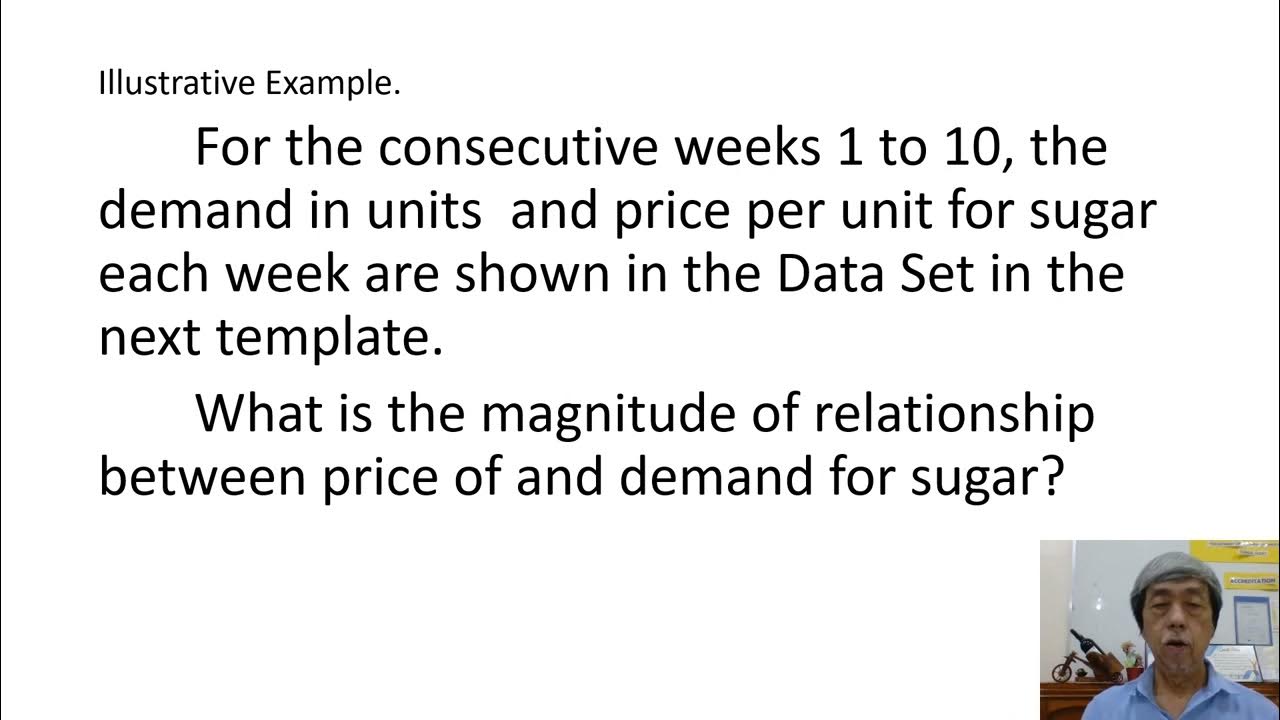
TLDRThis presentation explores the concepts of correlation and simple linear regression. Correlation quantifies the relationship between two quantitative variables, indicating both direction and strength through Pearson's correlation coefficient (r). A positive r indicates that as one variable increases, so does the other, while a negative r indicates an inverse relationship. The presentation demonstrates calculating r using data from basketball players’ heights and weights. It also covers simple linear regression, explaining how to derive the best fit line's equation to predict dependent variable values based on independent variables, highlighting practical applications using Excel functions.
Takeaways
- 😀 Correlation measures the direction and strength of a linear relationship between two quantitative variables.
- 😀 The variables are represented as x (height) and y (diameter) in a scatter plot.
- 😀 As height increases, trunk diameter also increases, indicating a positive correlation.
- 😀 In contrast, an increase in cuddling mods leads to a decrease in unblemished apples, indicating a negative correlation.
- 😀 Scatter plots can sometimes obscure relationships; careful analysis is needed to interpret the data accurately.
- 😀 The Pearson correlation coefficient (r) quantifies the degree of correlation, ranging from -1 to 1.
- 😀 r values from 0.9 to 1 indicate very high positive correlation, while values from 0 to 0.3 suggest negligible correlation.
- 😀 Data analysis can be performed using Excel or other statistical tools to calculate Pearson's r.
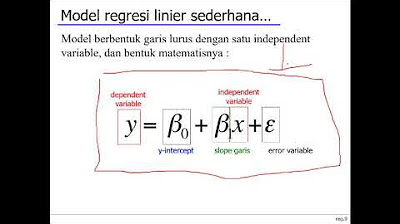
- 😀 Simple linear regression provides a method to predict values using the equation of the best fit line: y = a + bx.
- 😀 The slope (b) and y-intercept (a) of the regression line are calculated from the data, allowing for predictions based on x values.
Q & A
What is correlation in the context of the video?
-Correlation is used to determine the direction and magnitude of the linear relationship between two quantitative variables.
How is the correlation between height and diameter of a trunk illustrated?
-As the height increases, the diameter of the trunk also increases, indicating a positive correlation.
What is the relationship between cuddling mods and unblemished apples?
-As cuddling mods increase, the number of unblemished apples decreases, indicating a negative correlation.
What does a Pearson correlation coefficient (r) of 0.9 to 1 indicate?
-It indicates a very high positive correlation between the two variables.
What range of r values is considered to have negligible correlation?
-An r value from 0 to 0.3 is considered to have negligible correlation or no linear relationship.
How can the Pearson correlation coefficient be calculated?
-It can be calculated using a formula involving the summation of data observations, or by using statistical tools like Excel.
What data is used to determine the correlation between basketball players' heights and weights?
-The heights and weights of 14 UAP basketball players are used to determine the correlation.
What is the equation of the best fit line in simple linear regression?
-The equation of the best fit line follows the slope-intercept form: y = a + bx, where b is the slope and a is the y-intercept.
What were the values for slope (b) and y-intercept (a) in the basketball players' example?
-The slope (b) is 3.272, and the y-intercept (a) is -20.02.
How can the weight of a player with a height of 71 inches be estimated?
-By substituting the height of 71 inches into the best fit line equation, the estimated weight is calculated to be approximately 212.292 pounds.
Outlines

This section is available to paid users only. Please upgrade to access this part.
Upgrade NowMindmap

This section is available to paid users only. Please upgrade to access this part.
Upgrade NowKeywords

This section is available to paid users only. Please upgrade to access this part.
Upgrade NowHighlights

This section is available to paid users only. Please upgrade to access this part.
Upgrade NowTranscripts

This section is available to paid users only. Please upgrade to access this part.
Upgrade NowBrowse More Related Video

Data Mining 09 - Korelasi & Analisa Regresi (1/2)

Simple Linear Regression Concept | Statistics Tutorial #32 | MarinStatsLectures

Statistik Teori pertemuan ke ~ 9 Korelasi dan Regresi

REGRESSION AND CORRELATION EDDIE SEVA SEE

Week 6 Statistika Industri II - Analisis Regresi (part 1)

STATISTIKA - Regresi Linier Sederhana Cara Manual + Contoh Soal
5.0 / 5 (0 votes)