RESUMÃO - O que é o Fluxograma?
Summary
TLDRIn this video, Rocha introduces the concept of a flowchart, a key quality tool used to visually represent processes. He explains its historical origins, dating back to the 1920s by Frank and Lilian Gilbreth, and its application in various industries. Rocha walks viewers through a practical example of a flowchart, demonstrating how it can be used in a restaurant's process for closing a bill. He highlights the flowchart's structure, including start and decision points, and emphasizes its importance in managing both smooth and problematic scenarios. Rocha concludes by encouraging viewers to use simplified versions of the flowchart for clarity and ease of understanding.
Takeaways
- 😀 Flowcharts are a visual tool used in quality management to map out processes and workflows.
- 😀 The flowchart was introduced in the 1920s by Frank and Lilian Gilbreth.
- 😀 Key symbols in a flowchart include the oval (start/end), rectangle (activity), and diamond (decision point).
- 😀 Flowcharts help visualize both the ideal process and the potential issues or deviations.
- 😀 In the restaurant example, a flowchart was used to map out the process of closing a tab at the cashier.
- 😀 The flowchart simplifies complex processes by breaking them into clear steps with decision points.
- 😀 In the case of a problem (like an incorrectly filled-out tab), the flowchart guides the process of resolving it through a series of checks.
- 😀 If an issue isn’t resolved by checking with the waiter, the flowchart suggests involving a manager to resolve the problem.
- 😀 There are over 30 symbols that can be used in flowcharts, but a simplified version with just three is often enough for clarity.
- 😀 Using a simplified version of flowcharts helps make them more accessible and easier to understand, especially for practical application.
- 😀 Viewers are encouraged to interact with the video by liking, sharing, commenting, and following on Instagram for more content.
Q & A
What is a fluxogram?
-A fluxogram is a visual tool used to represent a process or workflow using geometric shapes and connecting arrows. It is part of the seven quality tools in management, and it helps in understanding the steps of a process in a simple, graphical format.
Who created the fluxogram?
-The fluxogram was created by Frank and Lilian Gilbreth in the 1920s. They developed it as a way to represent processes graphically.
What are the basic shapes used in a fluxogram?
-The basic shapes in a fluxogram include a circle for 'start,' a rectangle for 'process' or 'activity,' and a diamond for 'decision' or 'verification.' These are the most commonly used shapes in a simplified fluxogram.
Why does the speaker use glasses in the video?
-The speaker mentions wearing glasses to alleviate eye strain caused by the two softboxes (lighting) used during the video recording.
What real-life example does the speaker use to explain the fluxogram?
-The speaker uses the example of a restaurant's payment process, where the process involves receiving a 'comanda' (bill), checking if it is filled out correctly, entering it into the system, and receiving payment.
What happens if the comanda is not filled out correctly?
-If the comanda is not filled out correctly, the next step in the fluxogram is to verify the information with the waiter. If the issue is resolved, the system is updated, and payment is received. If the issue is not resolved, the manager is involved to resolve the issue.
How many geometric figures are typically used in a fluxogram?
-While there are approximately 30 different geometric figures that can be used in a fluxogram, the speaker suggests using just the three most common ones (circle, rectangle, and diamond) for simplicity and ease of understanding.
What is the importance of the fluxogram in businesses?
-The fluxogram is an essential tool for visualizing and analyzing processes in a business. It helps identify potential issues, streamline operations, and ensure that workflows are efficient and well-understood by all involved.
What is the 'seven tools of quality' mentioned in the script?
-The 'seven tools of quality' refer to a set of techniques used to improve and monitor the quality of processes in management. These include tools like the fluxogram, Pareto diagram, Ishikawa diagram (fishbone diagram), and others.
How does the speaker suggest viewers approach using fluxograms in their businesses?
-The speaker recommends using the simplified version of the fluxogram with the three basic shapes (circle, rectangle, and diamond) to ensure it is easy to understand and apply. This version is more commonly used and effective for most business processes.
Outlines

Esta sección está disponible solo para usuarios con suscripción. Por favor, mejora tu plan para acceder a esta parte.
Mejorar ahoraMindmap

Esta sección está disponible solo para usuarios con suscripción. Por favor, mejora tu plan para acceder a esta parte.
Mejorar ahoraKeywords

Esta sección está disponible solo para usuarios con suscripción. Por favor, mejora tu plan para acceder a esta parte.
Mejorar ahoraHighlights

Esta sección está disponible solo para usuarios con suscripción. Por favor, mejora tu plan para acceder a esta parte.
Mejorar ahoraTranscripts

Esta sección está disponible solo para usuarios con suscripción. Por favor, mejora tu plan para acceder a esta parte.
Mejorar ahoraVer Más Videos Relacionados

FLOW CHART (DIAGRAM ALIR DATA)

🔴 ¿ Qué es un DIAGRAMA DE FLUJO ? 🔼 Cómo HACER Diagramas de Flujo Paso a Paso + Ejemplos
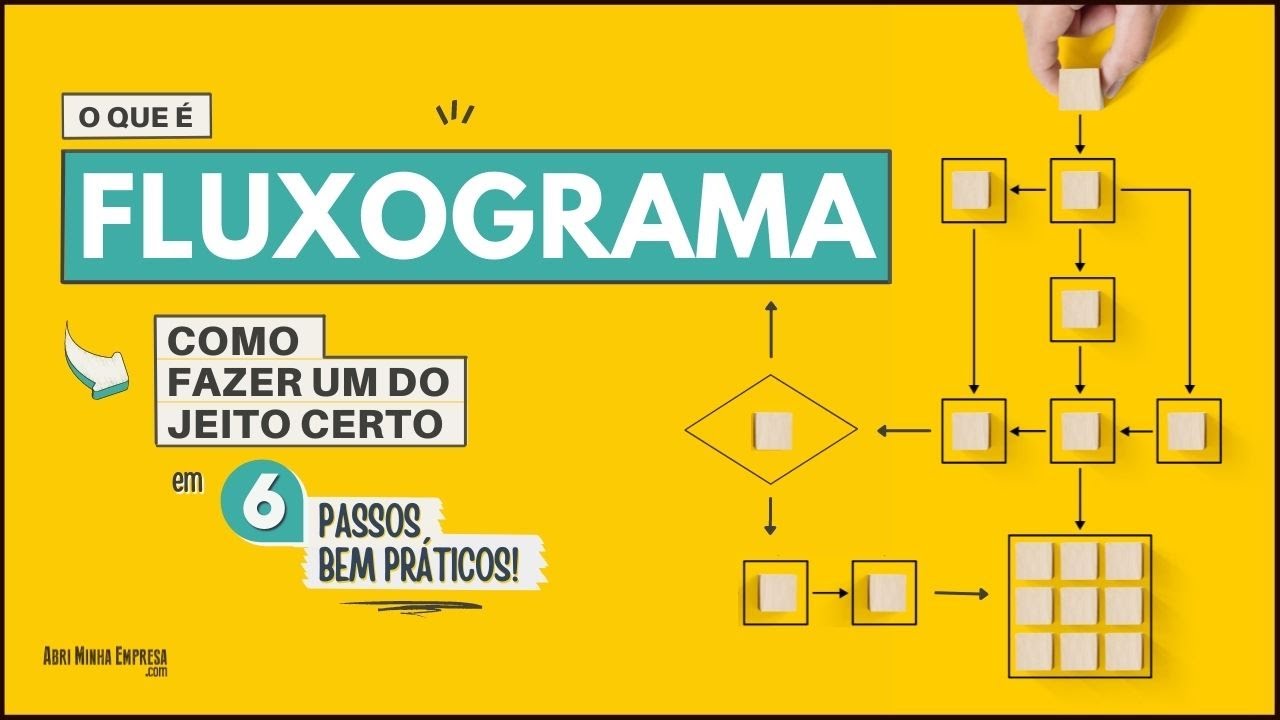
FLOWCHART WHAT IT IS AND HOW TO MAKE ONE (in 06 Very Practical Steps)
CORRELATION || MATHEMATICS IN THE MODERN WORLD

FLUXOGRAMA O QUE É? COMO FAZER? para que serve COMO APLICAR NA ADMINISTRAÇÃO/Curso grátis online
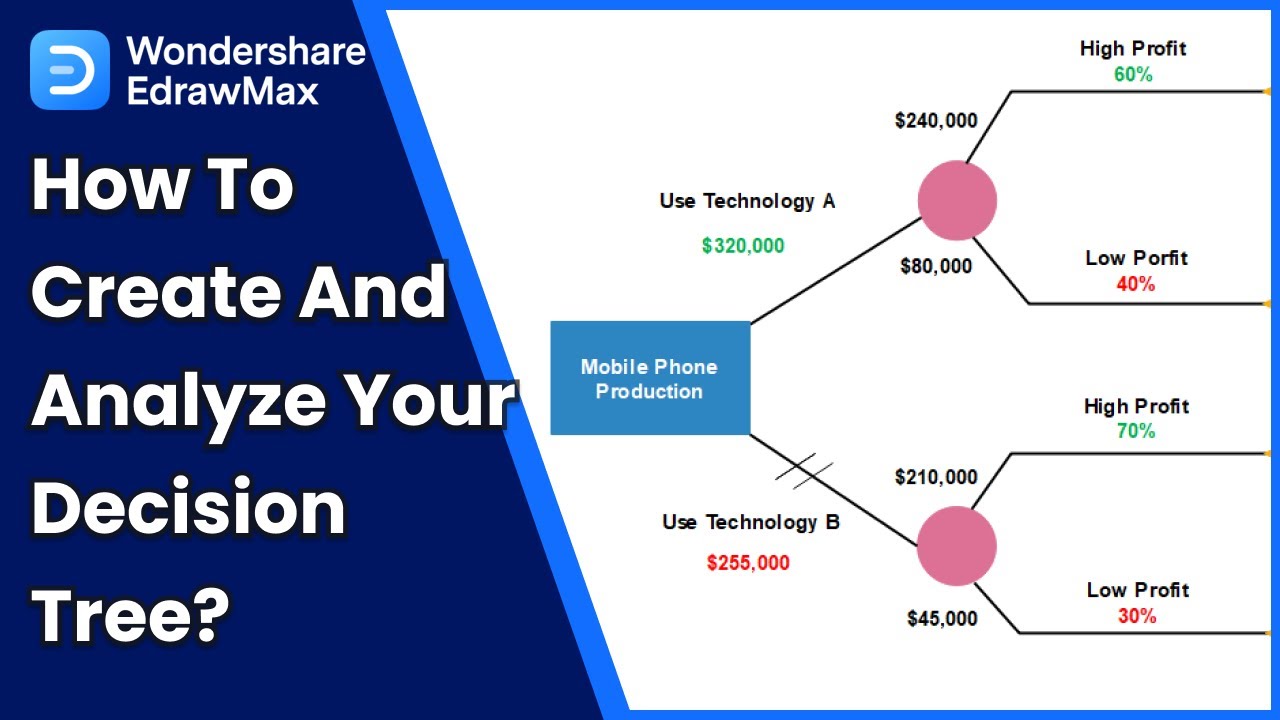
How to Create a Decision Tree | Decision Making Process Analysis
5.0 / 5 (0 votes)
