Velocity vs Time Graph (Clip) | Physics - Kinematics
Summary
TLDRThis video explains how to graph a car's velocity using position data. It demonstrates calculating average velocity between time intervals and shows how these values are plotted to visualize motion. The difference between average and instantaneous velocity is highlighted, illustrating that instantaneous velocity represents speed at a specific moment. Using speedometer readings as an example, the video shows how to graph instantaneous velocity over time and explains that more frequent measurements yield a more accurate representation of true motion. The lesson concludes by prompting viewers to consider how changes in the car's speed would affect the velocity graph.
Takeaways
- 😀 The script explains how to graph a car's average velocity over time using position data.
- 😀 The average velocity between two positions is calculated by the change in position divided by the change in time.
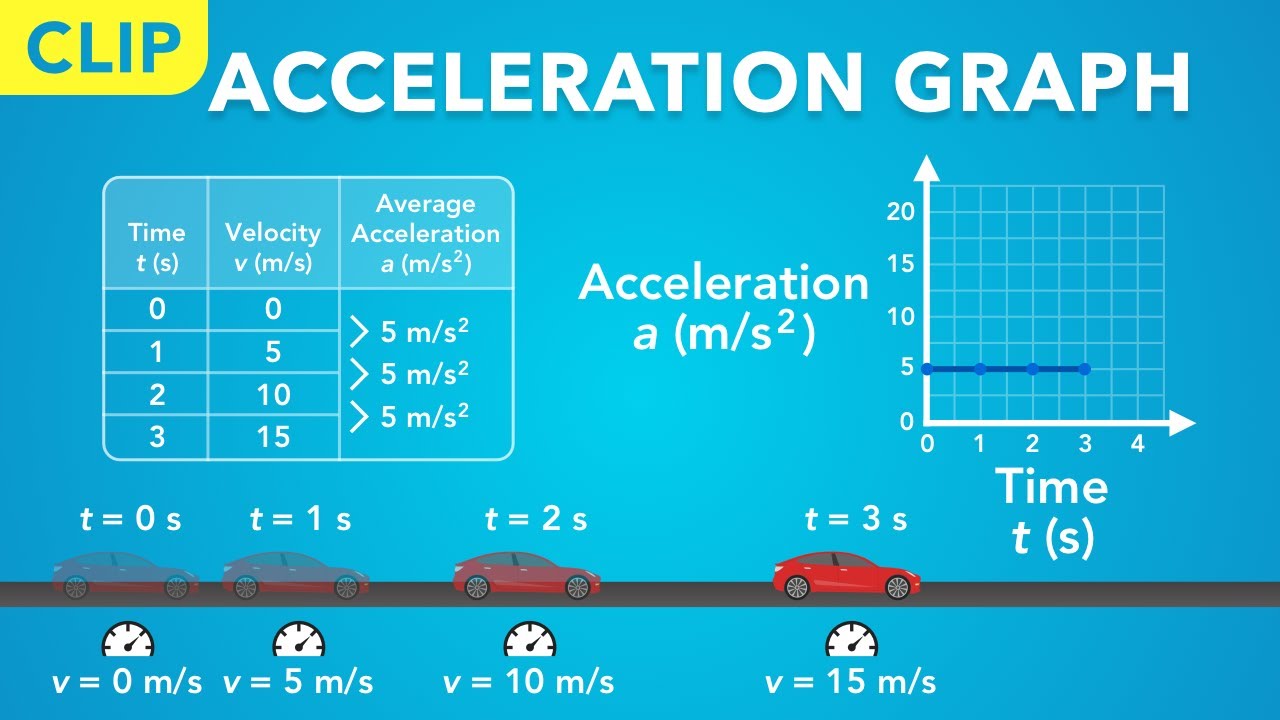
- 😀 The first average velocity calculation results in 5 meters per second between 0 and 1 second.
- 😀 The second average velocity calculation, from 1 second to 2 seconds, also results in 5 meters per second.
- 😀 The third average velocity calculation, from 2 seconds to 3 seconds, remains 5 meters per second.
- 😀 A graph is created with time on the horizontal axis and velocity on the vertical axis, representing the average velocities between each time interval.
- 😀 The graph uses lines to represent the average velocity for each time interval instead of specific points, as the velocity at each moment wasn't calculated.
- 😀 The average velocities are constant at 5 meters per second, indicating that the car may be moving at a constant speed, but we can't be certain without more data.
- 😀 The concept of instantaneous velocity is introduced, which refers to the car's velocity at a specific moment in time.
- 😀 The passenger records the car's instantaneous velocity using a speedometer, noting that the velocity stays at 5 meters per second at every second (0 to 3 seconds).
- 😀 A graph of instantaneous velocity is plotted with points representing velocity at specific times, and the points are connected by a line to show the true velocity over time.
Q & A
What is the formula for calculating average velocity between two positions?
-The average velocity is calculated using the formula v_avg = (x2 - x1) / (t2 - t1), where x2 and x1 are the positions at times t2 and t1, respectively.
How do you graph average velocity over time based on position data?
-To graph average velocity, use time on the horizontal axis and velocity on the vertical axis. Draw line segments representing the average velocity over each time interval, rather than plotting individual points.
Why doesn't the average velocity graph show the exact velocity at specific moments?
-Average velocity represents the overall change in position over a time interval, not the car's exact speed at any given instant, so it cannot show instantaneous fluctuations within the interval.
What is instantaneous velocity and how is it different from average velocity?
-Instantaneous velocity is the speed of the car at a specific moment in time, unlike average velocity, which only represents the speed over a period. Instantaneous velocity can be measured directly using a speedometer.
If a car moves at a constant speed, how do the average and instantaneous velocities compare?
-If the car's speed is constant, the instantaneous velocity at any moment is equal to the average velocity over any interval of time.
How can we make an instantaneous velocity graph more accurate?
-By recording the car's velocity at shorter intervals (e.g., every half second) and plotting these points, we can approximate the true velocity curve more accurately.
What would the velocity graph look like if the car's speed increases over time?
-The velocity graph would have a positive slope, rising as time increases, indicating that the car is accelerating.
Why might the average velocity be misleading if the car's speed varies during an interval?
-Because average velocity only shows the net change over the interval, it could hide fluctuations in speed. The car might have slowed down or sped up, but the average would still appear constant.
How do you determine the slope of a position-time graph in relation to velocity?
-The slope of a position-time graph at any point gives the instantaneous velocity at that point. For straight-line segments, the slope equals the average velocity over that interval.
Can the instantaneous velocity ever differ from the average velocity if the car is not moving at a constant speed?
-Yes, if the car accelerates or decelerates, the instantaneous velocity at a given time can be higher or lower than the average velocity over a time interval.
Why is connecting points with lines useful when graphing instantaneous velocity?
-Connecting points with lines helps visualize trends in the car's speed over time and provides a continuous representation of velocity between measured points.
Outlines

此内容仅限付费用户访问。 请升级后访问。
立即升级Mindmap

此内容仅限付费用户访问。 请升级后访问。
立即升级Keywords

此内容仅限付费用户访问。 请升级后访问。
立即升级Highlights

此内容仅限付费用户访问。 请升级后访问。
立即升级Transcripts

此内容仅限付费用户访问。 请升级后访问。
立即升级浏览更多相关视频
Acceleration vs Time Graph (Clip) | Physics - Kinematics

AP Physics1: Kinematics 4: Dot-Timer and Motion Graphs

Translating Motion Graphs: Position, Velocity, and Acceleration - IB Physics

GCSE Physics Revision "Acceleration"

Interpreting motion data | Physics | Khan Academy
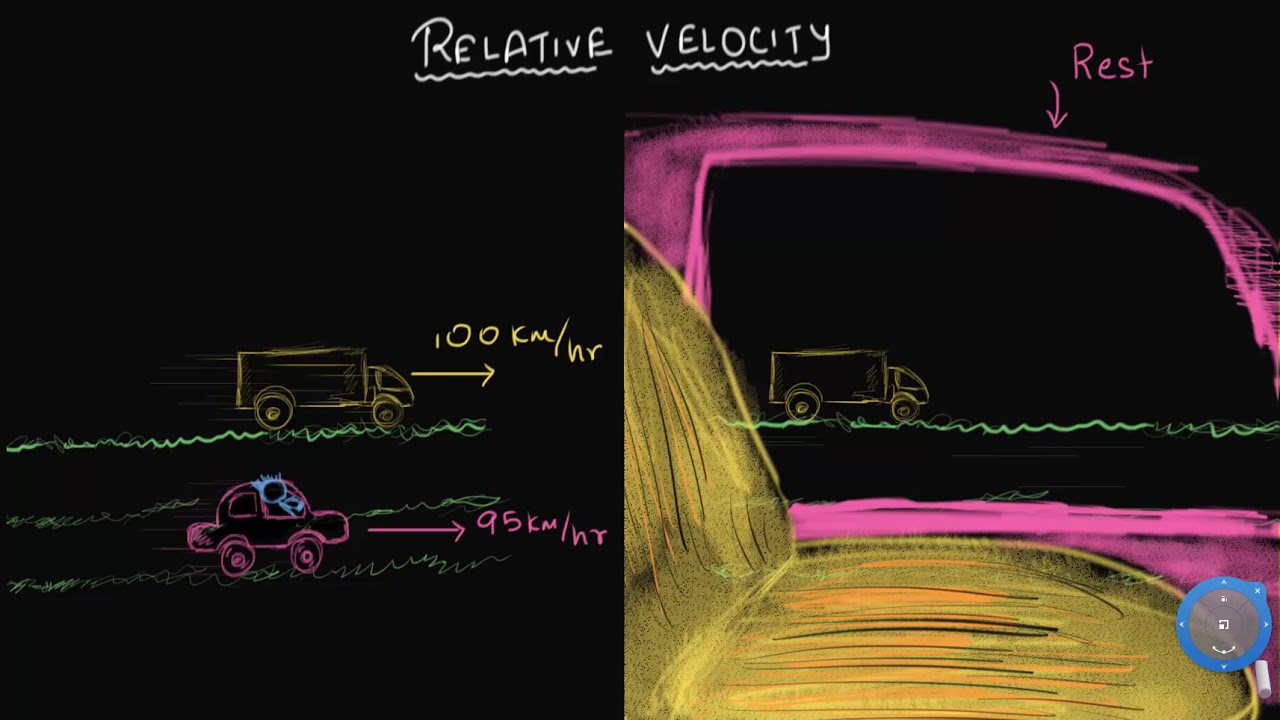
Intro to relative velocity | Class 11 (India) | Physics | Khan Academy
5.0 / 5 (0 votes)
