GCSE Physics Revision "Acceleration"
Summary
TLDRThis video from Free Size Lessons teaches the concept of acceleration, guiding viewers through its definition and calculation. It explains that acceleration is the change in velocity over time, using the formula a = Δv/Δt. The video provides examples, including a car's deceleration and a cyclist's acceleration, and introduces how to determine an object's acceleration from a velocity-time graph. It also covers calculating distance traveled from the area under the graph, offering tips for both constant and variable acceleration scenarios. The video concludes with a resource for further practice.
Takeaways
- 📚 The video is a physics lesson focusing on the concept of acceleration.
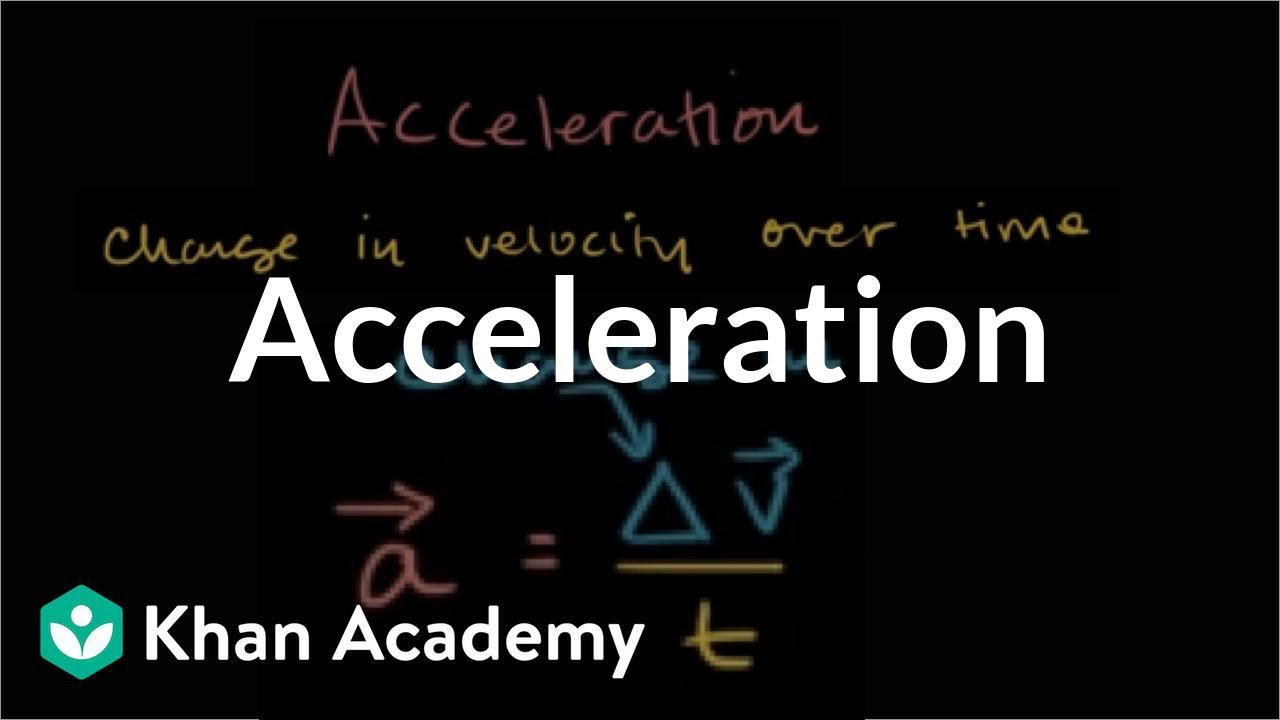
- 🚗 Acceleration is defined as the change in velocity over a given time and is calculated using the formula: acceleration = (final velocity - initial velocity) / time.
- 📉 A negative acceleration indicates deceleration, which is when an object is slowing down.
- 📈 The gradient of a velocity-time graph represents the acceleration of an object, with a horizontal line indicating constant velocity, an upward slope indicating acceleration, and a downward slope indicating deceleration.
- 📊 The total area under a velocity-time graph represents the distance traveled in a specific direction, which is the displacement.
- 🔢 For a graph with constant acceleration or deceleration, the total area can be calculated by dividing the graph into geometric shapes and summing their areas.
- 📐 In cases where the acceleration or deceleration is not constant, the total area under the graph is estimated by counting squares or estimating partial squares.
- 🚴♂️ An example problem involves calculating the acceleration of a cyclist whose velocity decreases from six meters per second to zero over 12 seconds, resulting in a negative acceleration.
- 🚗 Another example problem involves calculating the acceleration of a car that slows from 50 meters per second to 35 meters per second over 20 seconds, resulting in a positive acceleration.
- 📚 The video script emphasizes the importance of learning and memorizing the formula for acceleration as it may not be provided in an exam.
- 🔗 The video suggests additional practice with acceleration problems on velocity-time graphs can be found in the instructor's vision workbook, which is accessible through a provided link.
Q & A
What is the main topic of the video?
-The main topic of the video is acceleration, including its definition, calculation, and how to determine it from a velocity-time graph.
What is the formula for calculating acceleration?
-The formula for calculating acceleration is acceleration (in meters per second squared) equals the change in velocity (in meters per second) divided by the time (in seconds).
What is the significance of the gradient on a velocity-time graph?
-The gradient of a velocity-time graph represents the acceleration of an object. A horizontal line indicates constant velocity, an upward sloping line indicates acceleration, and a downward sloping line indicates deceleration.
How can you calculate the distance traveled by an object using a velocity-time graph?
-The total area under the velocity-time graph represents the distance traveled in a specific direction, which is the displacement. For constant acceleration or deceleration, the graph can be divided into geometric shapes to calculate the total area.
What is the difference between acceleration and deceleration?
-Acceleration is the rate at which an object's velocity increases, while deceleration is the rate at which an object's velocity decreases. Deceleration is often represented by a negative acceleration value.
In the example of the car, what is the final velocity after accelerating from 50 m/s north to 35 m/s north over 20 seconds?
-The final velocity of the car is 35 meters per second north.
What is the acceleration of the cyclist who slows down from 6 m/s east to 0 m/s over 12 seconds?
-The acceleration of the cyclist is -0.5 meters per second squared, indicating deceleration.
How do you calculate the acceleration from the first part of the velocity-time graph shown in the video?
-You calculate the acceleration by subtracting the initial velocity from the final velocity and dividing by the time taken, which in the example is (15 m/s - 0 m/s) / 100 s = 0.15 m/s².
What is the total displacement calculated from the area under the velocity-time graph with constant acceleration or deceleration?
-In the example given, the total displacement is the sum of the areas of the geometric shapes, which is 4,500 meters.
How can you estimate the total distance traveled when the acceleration and deceleration are not constant in a velocity-time graph?
-When acceleration and deceleration are not constant, you can estimate the total distance by counting the number of squares and estimating the area of partial squares, then multiplying by the area of each square.
What resource is mentioned in the video for additional practice on acceleration problems involving velocity-time graphs?
-The video mentions a vision workbook with plenty of questions on acceleration and velocity-time graphs, which can be accessed by clicking on the provided link.
Outlines

This section is available to paid users only. Please upgrade to access this part.
Upgrade NowMindmap

This section is available to paid users only. Please upgrade to access this part.
Upgrade NowKeywords

This section is available to paid users only. Please upgrade to access this part.
Upgrade NowHighlights

This section is available to paid users only. Please upgrade to access this part.
Upgrade NowTranscripts

This section is available to paid users only. Please upgrade to access this part.
Upgrade NowBrowse More Related Video
Acceleration | One-dimensional motion | Physics | Khan Academy

GCSE Physics Revision "Acceleration 2"
Introductory Uniformly Angularly Accelerated Motion Problem - A CD Player
Force of Impact Equation Derivation

Introduction to Acceleration with Prius Brake Slamming Example Problem

FOURIER SERIES LECTURE 1 | STUDY OF DEFINITION AND ALL BASIC POINTS @TIKLESACADEMY
5.0 / 5 (0 votes)