Interpreting motion data | Physics | Khan Academy
Summary
TLDRThis video lesson introduces position-time graphs, using the example of a car moving at constant velocity. By analyzing a position-time table, the instructor explains how to determine velocity and recognize whether an object is accelerating or decelerating. The visual representation of motion through graphs illustrates key concepts, such as the relationship between the slope of the graph and velocity. The lesson concludes with comparisons of different motion scenarios, highlighting the significance of understanding these graphs in analyzing motion effectively.
Takeaways
- 😀 Position-time graphs are essential tools for analyzing motion, allowing us to visualize an object's position over time.
- 🚗 A car traveling at a constant velocity will produce a straight line on a position-time graph, indicating consistent displacement over equal time intervals.
- 📏 The slope of a position-time graph represents the velocity of the object; a steeper slope indicates a higher velocity.
- ⏳ Recording positions at regular time intervals creates a position-time table, which can be converted into a graph for analysis.
- 🔄 If an object accelerates, its position-time graph will curve, showing increasing distances covered in each time interval.
- 📉 A decreasing slope in a position-time graph indicates that an object is decelerating, meaning it is slowing down.
- ⚖️ The relationship between the vertical distance (position) and horizontal distance (time) on a graph helps determine the velocity of the object.
- 📝 Comparing slopes of different position-time graphs allows for direct comparison of velocities of different objects.
- 📈 An object that moves with a consistent increase in distance will display a curve that gets steeper, signifying acceleration.
- 🔍 Understanding position-time graphs enables the identification of motion characteristics, such as constant speed, acceleration, and deceleration.
Q & A
What is the purpose of position-time graphs?
-Position-time graphs are used to analyze motion by visually representing an object's position over time, helping to determine its velocity and whether it is accelerating or decelerating.
How do you create a position-timetable?
-A position-timetable is created by recording an object's position at regular time intervals, such as every five seconds, and then filling in the positions accordingly.
What does a straight line on a position-time graph indicate?
-A straight line on a position-time graph indicates that the object is moving at a constant velocity, as it travels the same distance in equal time intervals.
How do you calculate velocity from a position-timetable?
-Velocity is calculated by dividing the displacement (change in position) by the time interval. For example, if an object moves from 20 to 30 meters in 5 seconds, the velocity is 10 meters divided by 5 seconds, resulting in 2 meters per second.
What is the significance of the slope in a position-time graph?
-The slope of a position-time graph represents the velocity of the object. A steeper slope indicates a higher velocity, while a gentler slope indicates a lower velocity.
What can be inferred if the position-time graph is curved?
-If the position-time graph is curved, it indicates that the object is accelerating or decelerating, as the slope (and thus the velocity) is changing over time.
What does it mean if an object covers more distance in equal time intervals?
-If an object covers more distance in equal time intervals, it is accelerating, meaning its velocity is increasing over time.
How can you tell if an object is decelerating from a position-time graph?
-An object is decelerating if the graph is curved and the slope decreases over time, indicating that the object's velocity is decreasing.
What is the relationship between position-time graphs and oil drop diagrams?
-Both position-time graphs and oil drop diagrams represent the same data about an object's motion, with position-time graphs providing a clearer visual representation of velocity and acceleration.
Why is it important to identify the origin when plotting a position-time graph?
-Identifying the origin is important because it serves as the reference point from which all other positions are measured, ensuring that the graph accurately represents the object's motion.
Outlines

This section is available to paid users only. Please upgrade to access this part.
Upgrade NowMindmap

This section is available to paid users only. Please upgrade to access this part.
Upgrade NowKeywords

This section is available to paid users only. Please upgrade to access this part.
Upgrade NowHighlights

This section is available to paid users only. Please upgrade to access this part.
Upgrade NowTranscripts

This section is available to paid users only. Please upgrade to access this part.
Upgrade NowBrowse More Related Video
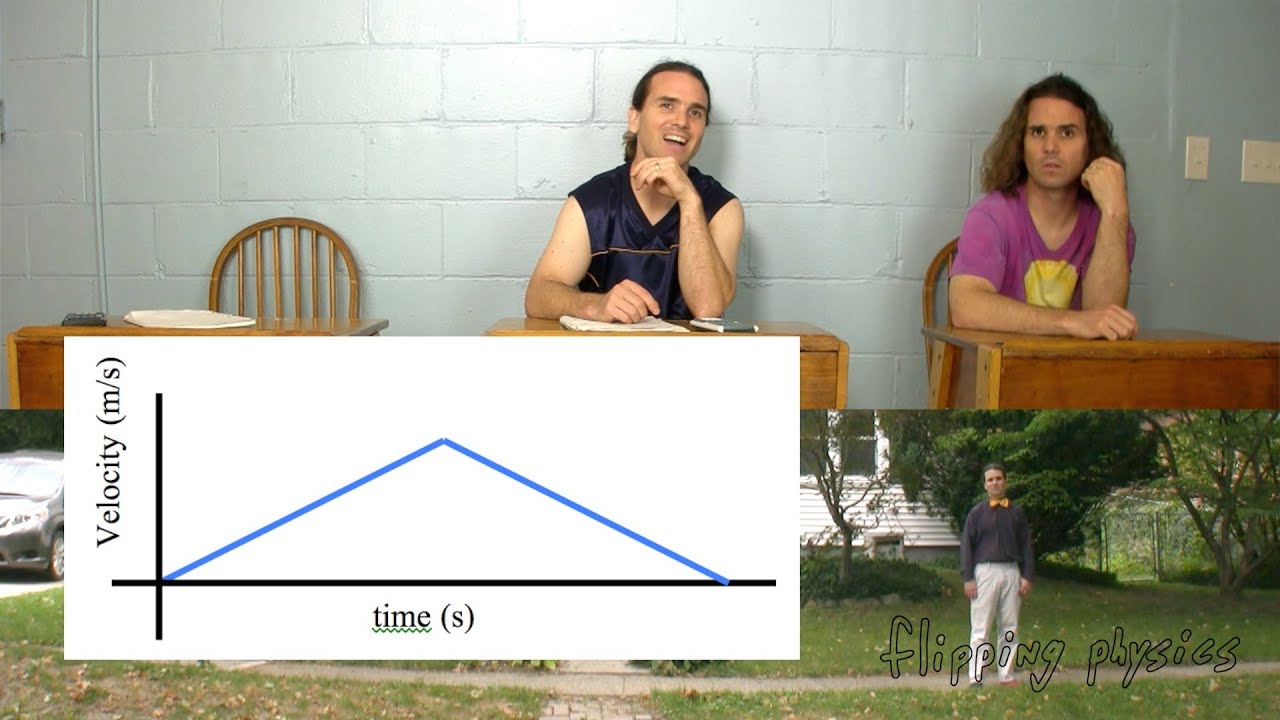
Walking Position, Velocity and Acceleration as a Function of Time Graphs
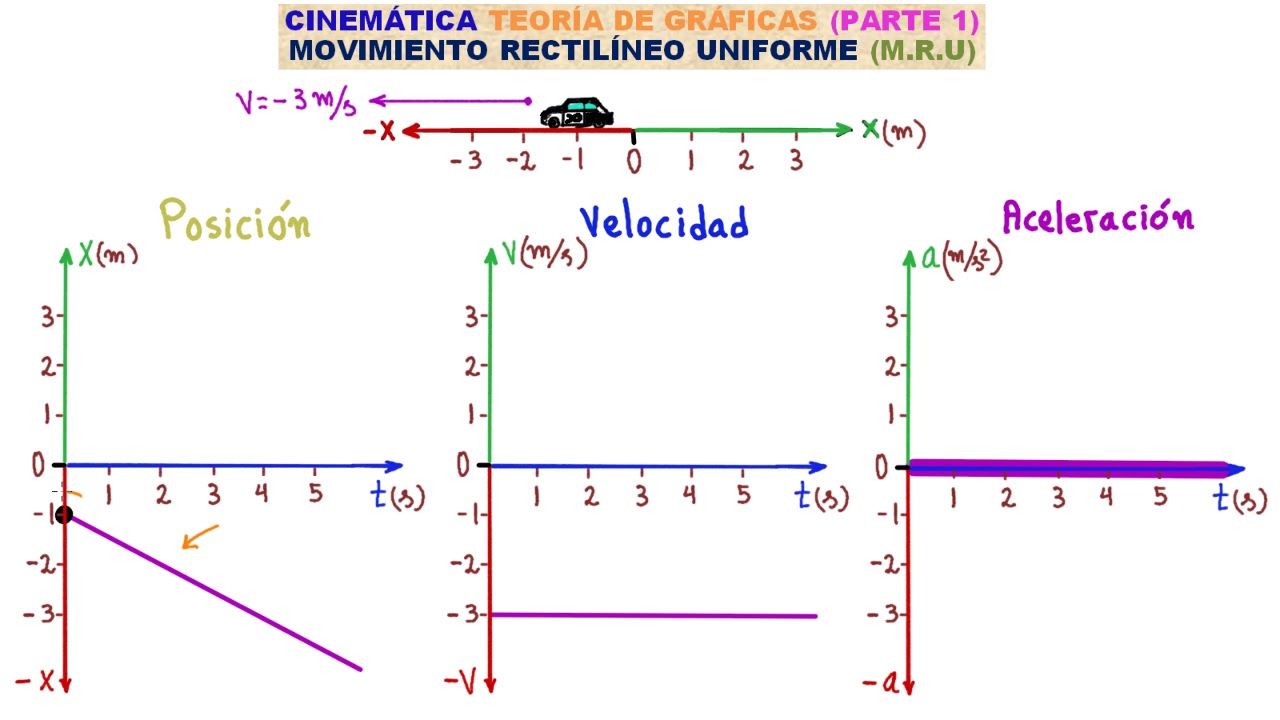
CINEMÁTICA. GRÁFICAS DEL M.R.U TEORÍA 1 [APRENDE LOS GRÁFICOS DE POSICIÓN, VELOCIDAD Y ACELERACIÓN]

MOVIMENTO UNIFORME | M.U FÍSICA

High School Physics: Graphing Motion
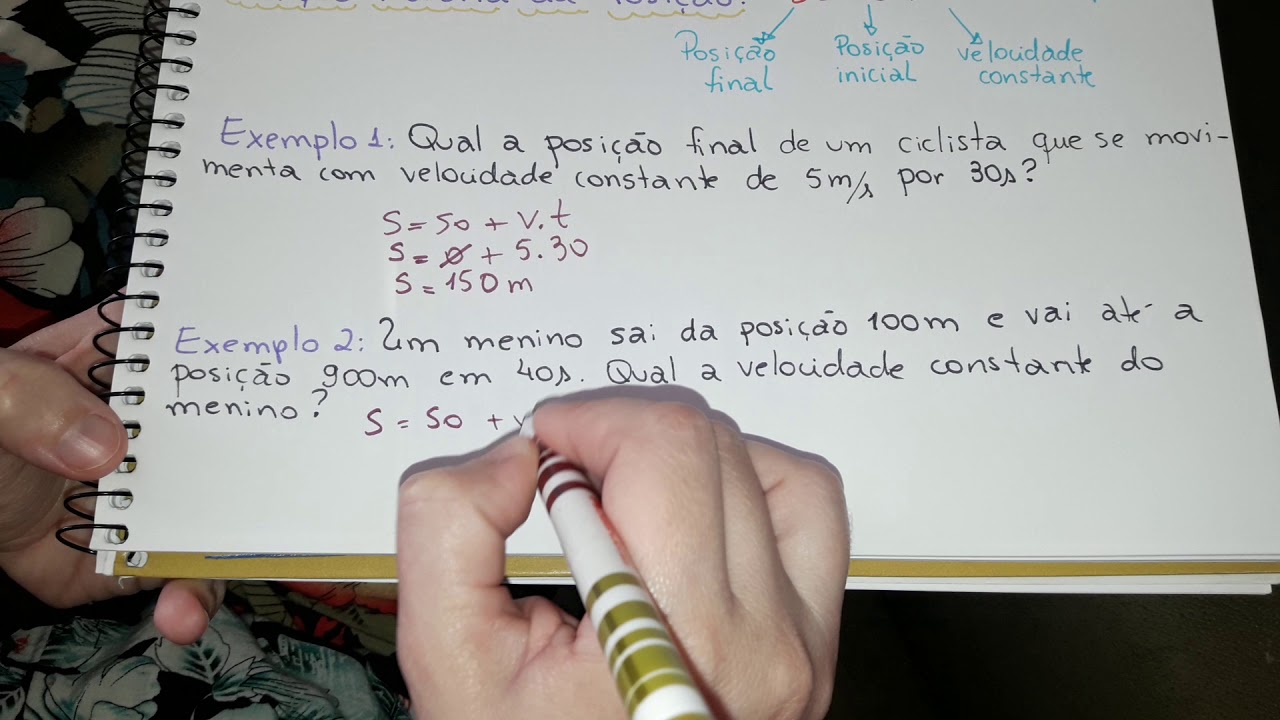
Movimento Retilíneo Uniforme - teoria e exemplo resolvido

Worked example: motion problems (with definite integrals) | AP Calculus AB | Khan Academy
5.0 / 5 (0 votes)