Translating Motion Graphs: Position, Velocity, and Acceleration - IB Physics
Summary
TLDRThis video explains how to translate between position, velocity, and acceleration graphs in physics. It covers key concepts such as the relationships between these graphs: velocity is the slope of a position graph, and acceleration is the slope of a velocity graph. The video uses various examples to demonstrate how to interpret different slopes and areas under curves. It also introduces the idea of using tangent lines to understand changing velocities in curved graphs. The goal is to help students better understand the translation of motion between different graph types.
Takeaways
- 📊 Translating between position, velocity, and acceleration graphs involves understanding how one graph can reflect the same motion in different ways.
- 🛤️ The velocity graph is the slope of the position-time graph, and the acceleration graph is the slope of the velocity-time graph.
- 📈 The area under the curve of an acceleration graph indicates the change in velocity, while the area under the curve of a velocity graph shows the change in position.
- 🚶♂️ Constant velocity in a position-time graph is represented by a straight line, and a constant slope means constant velocity.
- 🔄 Tangent lines can help estimate velocity on a curved position-time graph, where the slope is continuously changing.
- ⏳ A steep upward slope in a position-time graph means high positive velocity, while a steep downward slope indicates a high negative velocity.
- 📉 Translating from a velocity graph to a position graph involves understanding that velocity gives the slope of the position graph, but not the starting position.
- 🔀 Going from acceleration to velocity: Constant positive acceleration results in a steadily increasing velocity, and negative acceleration shows a steady decrease in velocity.
- 🔁 For curved velocity-time graphs, translating to position-time graphs will often result in a smooth curve where velocity changes gradually.
- 📘 Translating between all three graph types can be simplified using the relationships between slope and area under the curve, making it easier to predict changes in motion.
Q & A
What is the relationship between position, velocity, and acceleration graphs?
-The velocity graph represents the slope of the position graph, while the acceleration graph represents the slope of the velocity graph. Additionally, the area under the curve of an acceleration graph represents the change in velocity, and the area under the curve of a velocity graph represents the change in position.
How can you determine velocity from a position-time graph?
-Velocity is the slope of the position-time graph. A steep upward slope indicates a high positive velocity, a flat line indicates zero velocity, and a downward slope indicates negative velocity.
How can you tell if an object is accelerating or decelerating from an acceleration graph?
-An object is accelerating if the acceleration is positive, meaning it is speeding up in the direction of motion. If the acceleration is negative, the object is decelerating, which means it is slowing down.
What is the significance of tangent lines when dealing with curved position-time graphs?
-Tangent lines represent the slope at specific points on a curved position-time graph. By examining the slope of these tangent lines, you can understand how the velocity is changing at each point.
What does a flat line on a velocity-time graph indicate?
-A flat line on a velocity-time graph indicates that the velocity is constant over time, meaning there is no acceleration or deceleration.
How do you translate a velocity-time graph into an acceleration-time graph?
-To translate a velocity-time graph into an acceleration-time graph, observe the slope of the velocity graph. A positive slope corresponds to positive acceleration, while a negative slope corresponds to negative acceleration. If the slope is zero, the acceleration is zero.
How does the area under a velocity-time graph relate to the position of an object?
-The area under a velocity-time graph represents the change in position (displacement) of an object over time.
What does a changing slope on a velocity-time graph tell you about an object’s acceleration?
-A changing slope on a velocity-time graph indicates that the acceleration is not constant. If the slope is increasing, acceleration is positive. If the slope is decreasing, acceleration is negative.
Why is it important to distinguish between steep and shallow slopes in motion graphs?
-Steep slopes represent larger values (more rapid changes) in velocity or acceleration, while shallow slopes represent smaller values. Recognizing this helps in accurately translating between position, velocity, and acceleration graphs.
How do you translate from a velocity-time graph to a position-time graph?
-To translate from a velocity-time graph to a position-time graph, you consider the slope of the position graph based on the velocity. A positive velocity means the position graph will have a positive slope, and a negative velocity will correspond to a downward slope. The magnitude of the velocity affects how steep the position graph is.
Outlines

This section is available to paid users only. Please upgrade to access this part.
Upgrade NowMindmap

This section is available to paid users only. Please upgrade to access this part.
Upgrade NowKeywords

This section is available to paid users only. Please upgrade to access this part.
Upgrade NowHighlights

This section is available to paid users only. Please upgrade to access this part.
Upgrade NowTranscripts

This section is available to paid users only. Please upgrade to access this part.
Upgrade NowBrowse More Related Video
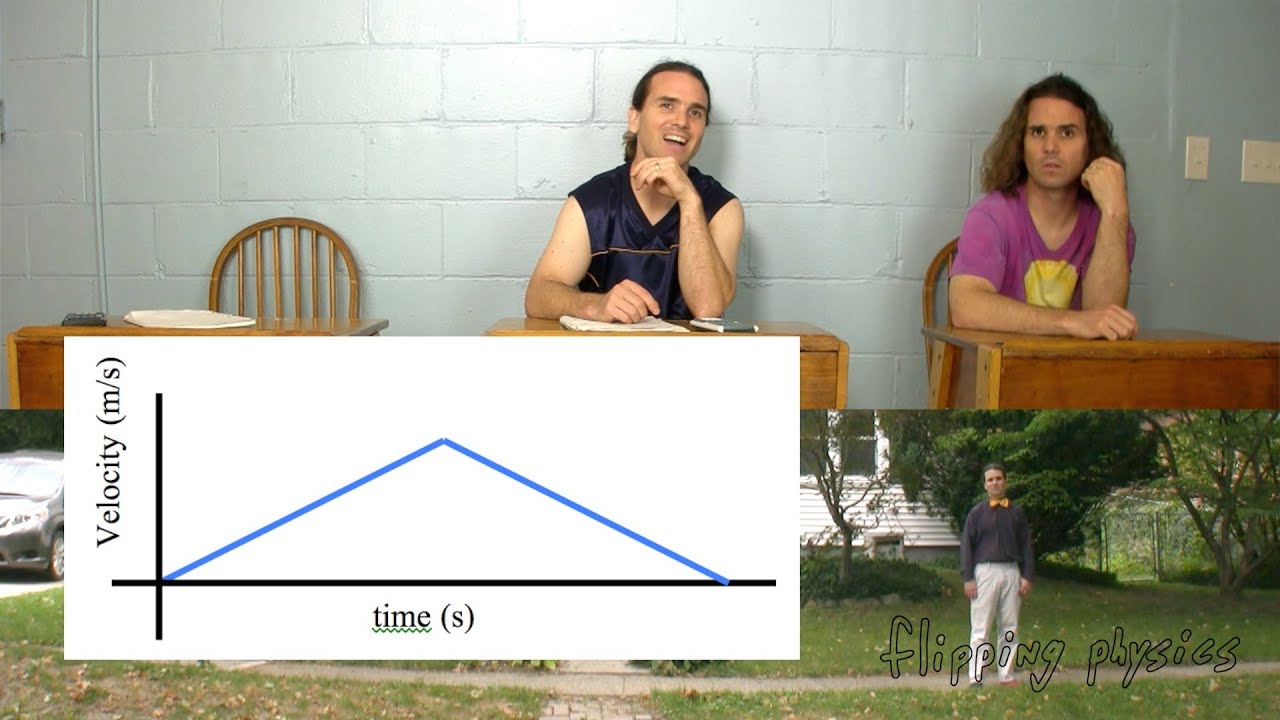
Walking Position, Velocity and Acceleration as a Function of Time Graphs
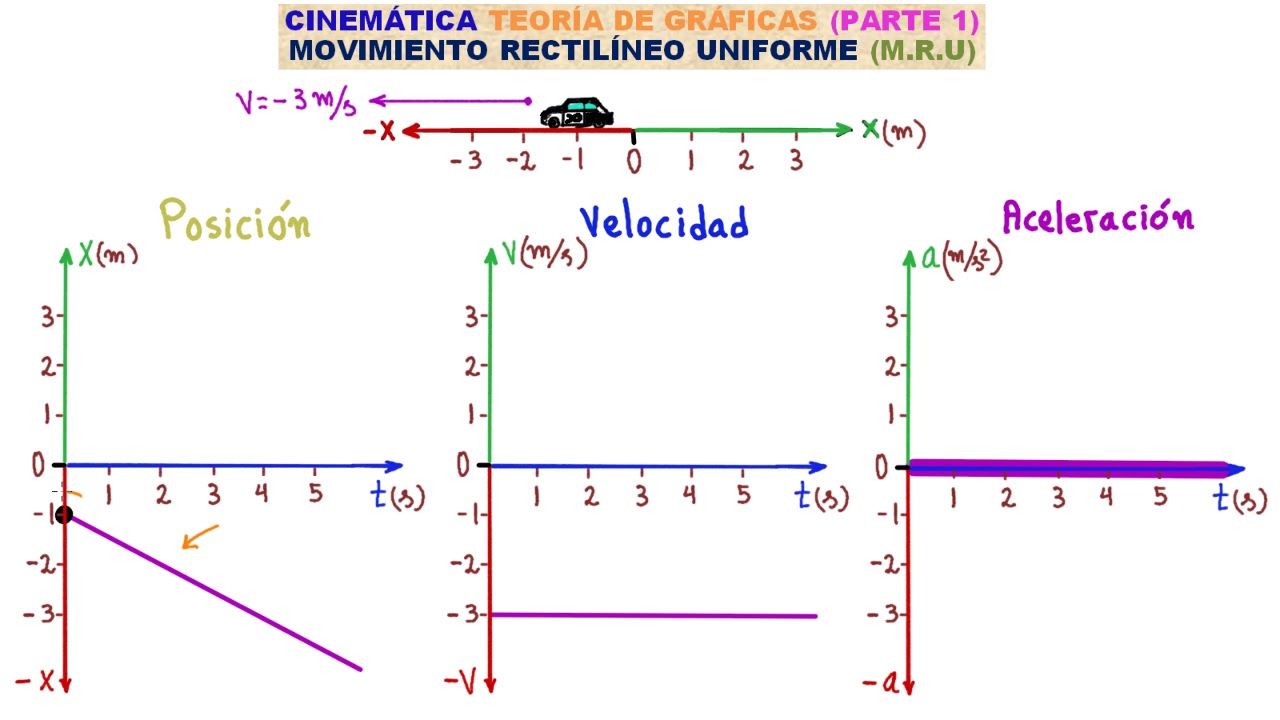
CINEMÁTICA. GRÁFICAS DEL M.R.U TEORÍA 1 [APRENDE LOS GRÁFICOS DE POSICIÓN, VELOCIDAD Y ACELERACIÓN]

Aprenda a LER um Gráfico de VELOCIDADE X TEMPO | CINEMÁTICA

Le mouvement rectiligne uniformément accéléré (1/2) | Physique | Alloprof
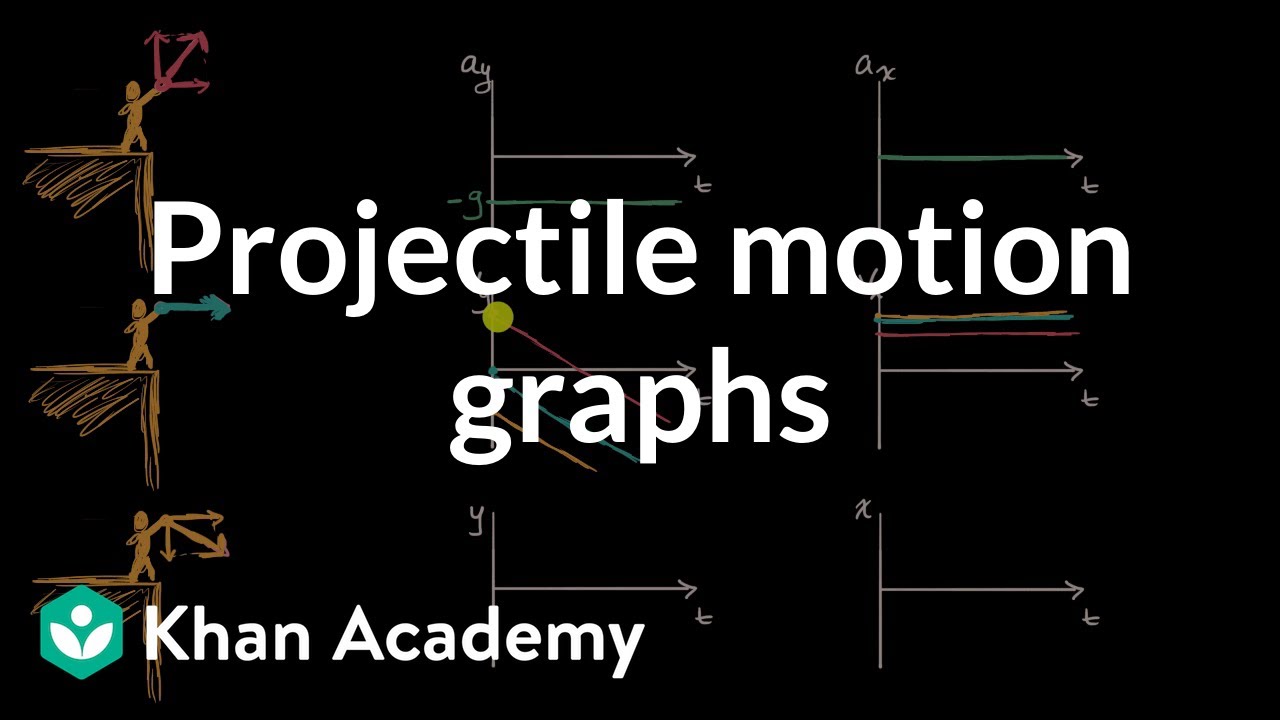
Projectile motion graphs | Two-dimensional motion | AP Physics 1 | Khan Academy

High School Physics: Graphing Motion
5.0 / 5 (0 votes)