Acceleration vs Time Graph (Clip) | Physics - Kinematics
Summary
TLDRThe video explores how to graph a car's acceleration over time, building on concepts of position and velocity. Using velocity data recorded at one-second intervals, it calculates the car's average acceleration between each point, revealing a constant acceleration of 5 m/s². The lesson emphasizes that while velocity increases steadily, the acceleration remains unchanged. Viewers are guided through plotting acceleration on a graph with time on the horizontal axis and acceleration on the vertical axis, resulting in a horizontal line. The video also introduces accelerometers, highlighting that real-world devices, like smartphones, can measure acceleration at any instant, not just as averages.
Takeaways
- 😀 Acceleration is defined as the change in velocity over time.
- 😀 The car’s velocity increases steadily from 0 m/s to 15 m/s over 3 seconds.
- 😀 Each one-second interval shows a consistent increase of 5 m/s in velocity.
- 😀 The average acceleration between each pair of time points is 5 m/s².
- 😀 Since acceleration remains the same in each interval, it is constant.
- 😀 A constant acceleration means velocity increases at a steady rate.
- 😀 The acceleration vs. time graph is a horizontal line at 5 m/s².
- 😀 Time is plotted on the horizontal axis, while acceleration is on the vertical axis.
- 😀 The graph shown represents average acceleration over each time interval.
- 😀 Instantaneous acceleration can be measured using devices called accelerometers.
- 😀 Smartphones contain built-in accelerometers that can measure acceleration.
- 😀 In most basic physics courses, acceleration is often treated as constant rather than changing over time.
Q & A
What is the main focus of the video script?
-The main focus of the script is to explain how acceleration, velocity, and time are related, using a car's motion as an example. It explores the calculation of average acceleration and the concept of measuring instantaneous acceleration using accelerometers.
How do we calculate acceleration in the script?
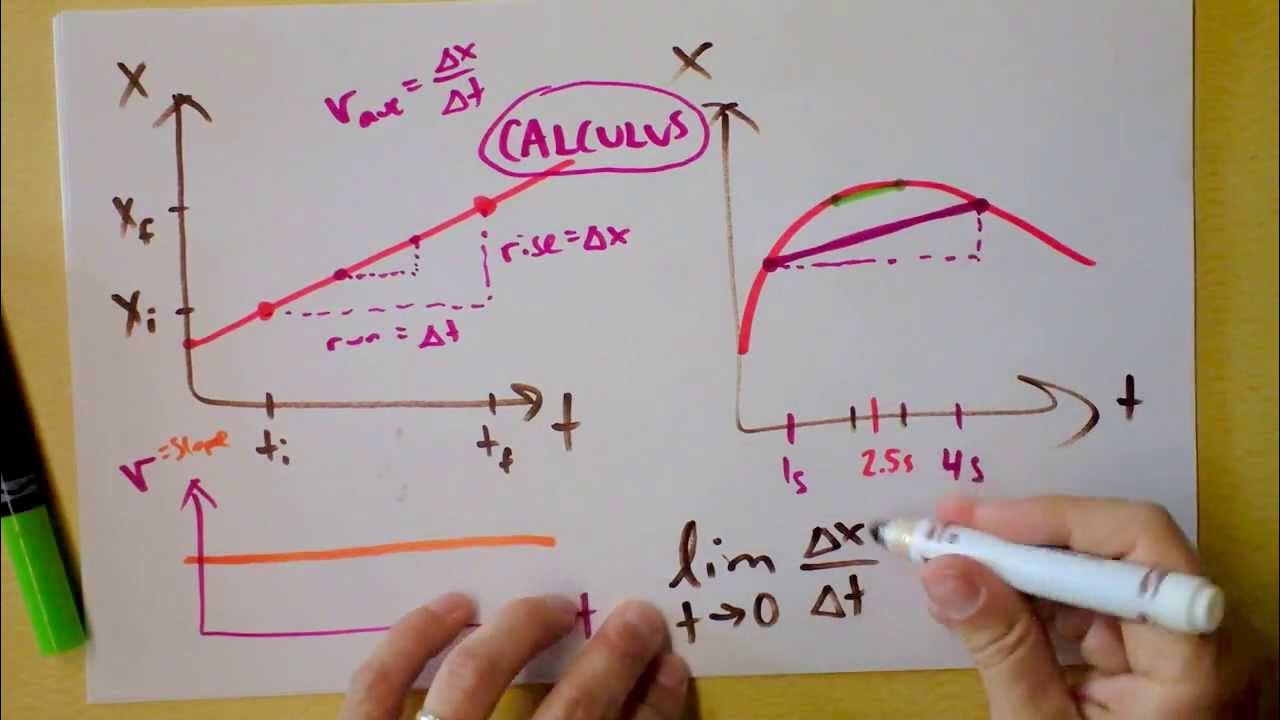
-Acceleration is calculated using the formula for average acceleration, which is the change in velocity divided by the change in time. In this case, the velocity increases by 5 meters per second every second, resulting in a constant acceleration of 5 meters per second squared between each pair of time points.
What is the significance of the constant acceleration in the script?
-The constant acceleration of 5 meters per second squared means that the car's velocity increases at a steady rate over time. This is important because it helps to simplify the understanding of motion, as the acceleration does not change during the observed time periods.
What are the time intervals used to calculate acceleration?
-The time intervals used to calculate acceleration are from 0 to 1 second, from 1 to 2 seconds, and from 2 to 3 seconds. In each case, the acceleration is calculated as 5 meters per second squared.
How is the graph of acceleration constructed?
-The graph of acceleration is constructed by plotting time on the horizontal axis and acceleration on the vertical axis. Since the acceleration is constant at 5 meters per second squared during the observed time intervals, the graph is a horizontal line at this value.
What is the difference between average and instantaneous acceleration?
-Average acceleration is calculated over a time interval, whereas instantaneous acceleration measures the acceleration at a specific point in time. In the script, average acceleration is calculated, but the possibility of measuring instantaneous acceleration is also introduced through the use of accelerometers.
What is an accelerometer, and how does it relate to the script?
-An accelerometer is a device that measures the acceleration of an object at any given moment. In the context of the script, it is used to suggest that instead of calculating average acceleration over time intervals, it is possible to measure the car's instantaneous acceleration at specific points in time.
Why is the acceleration in the script constant over time?
-The acceleration is constant because the velocity of the car is increasing at a uniform rate (5 meters per second every second). This results in a constant rate of change in velocity, which leads to a constant acceleration.
What concept does the script demonstrate about velocity and acceleration?
-The script demonstrates the relationship between velocity and acceleration, specifically how a constant acceleration leads to a steady increase in velocity over time. It also shows that while velocity changes, acceleration can remain constant.
What is the significance of the velocity data points provided in the script?
-The velocity data points (0 meters per second at 0 seconds, 5 meters per second at 1 second, 10 meters per second at 2 seconds, and 15 meters per second at 3 seconds) serve as the basis for calculating acceleration. These points show how the velocity increases over time, with each interval representing a uniform change in speed.
Outlines

This section is available to paid users only. Please upgrade to access this part.
Upgrade NowMindmap

This section is available to paid users only. Please upgrade to access this part.
Upgrade NowKeywords

This section is available to paid users only. Please upgrade to access this part.
Upgrade NowHighlights

This section is available to paid users only. Please upgrade to access this part.
Upgrade NowTranscripts

This section is available to paid users only. Please upgrade to access this part.
Upgrade NowBrowse More Related Video

Velocity vs Time Graph (Clip) | Physics - Kinematics

GCSE Physics Revision "Acceleration"

Constant Velocity compared to Constant Acceleration
Instantaneous Velocity, Acceleration, Jerk, Slopes, Graphs vs. Time | Doc Physics
Kinematics Part 2 (Computations Naman) Physics Explained In Tagalog/Filipino

Translating Motion Graphs: Position, Velocity, and Acceleration - IB Physics
5.0 / 5 (0 votes)