Uji Validitas dan Reliabilitas dengan EXCEL - Uji Validitas Pearson Correlation
Summary
TLDRThis video tutorial explains how to analyze validity and reliability tests using Microsoft Excel. It covers the key concepts of validity (ensuring a questionnaire measures what it’s supposed to) and reliability (assessing consistency over repeated tests). The video demonstrates step-by-step how to conduct the Pearson validity test and Cronbach Alpha reliability test using Excel, with practical examples. The goal is to ensure that research questionnaires are both valid and reliable, thus ensuring accurate data collection for research studies.
Takeaways
- 😀 The validity test determines whether a questionnaire is valid for measuring and obtaining data from respondents.
- 😀 The reliability test checks the consistency of a questionnaire to ensure it can be trusted across repeated uses.
- 😀 Data is considered valid if the calculated R value is greater than the R table value or the significance level is below 0.05.
- 😀 Data is reliable if the Cronbach Alpha value is greater than 0.70.
- 😀 The quality of a research questionnaire is assessed by verifying its validity and reliability.
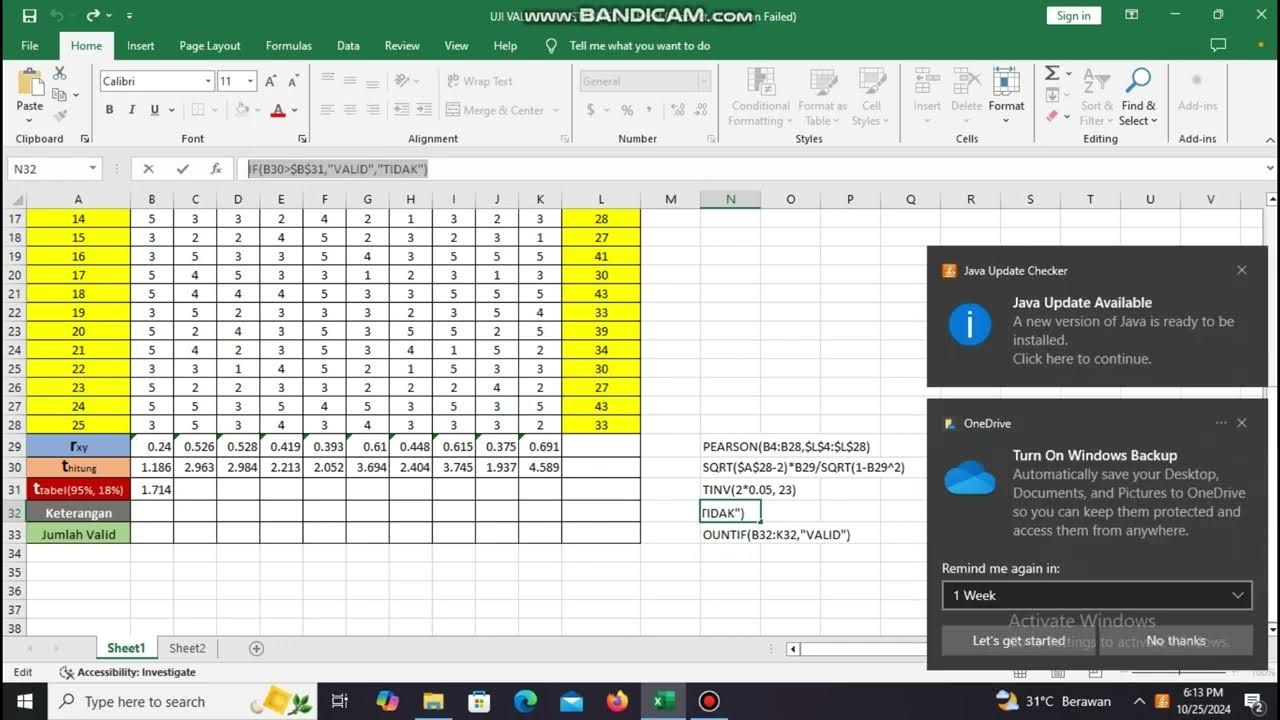
- 😀 To perform the Pearson validity test in Excel, use the CORREL formula with data from individual items and total scores to calculate the R value.
- 😀 After calculating the R values, compare them to the R table value (0.361) to determine whether each item is valid or invalid.
- 😀 Items are concluded as valid if their R values exceed the R table value; otherwise, they are deemed invalid.
- 😀 For the Cronbach Alpha reliability test, calculate the variance for each item using the VAR function and sum them up to determine total variance.
- 😀 The Cronbach Alpha formula requires the number of items, variance values, and total variance to determine reliability. A value greater than 0.70 indicates reliable data.
Q & A
What is the purpose of the validity test in research?
-The validity test aims to determine whether the questionnaire used by researchers accurately measures what it is intended to measure and effectively gathers relevant data from respondents.
What does the reliability test aim to measure in a questionnaire?
-The reliability test measures the consistency of the questionnaire. It ensures that the questionnaire yields similar results when used repeatedly at different times under similar conditions.
How is data declared valid in a validity test?
-Data is declared valid if the calculated R value is greater than the R table value or if the significance value is less than 0.05.
What is the threshold value of Cronbach's Alpha for reliability in this context?
-The threshold value for Cronbach's Alpha is 0.70. If the Cronbach's Alpha value is greater than 0.70, the questionnaire is considered reliable.
What formula is used to calculate the Pearson validity in Microsoft Excel?
-The Pearson validity is calculated using the CORREL formula in Excel, which compares the correlation between the individual item data and the total score data.
How do you determine if an item in the questionnaire is valid using the R count and R table?
-To determine validity, you compare the calculated R value (R count) to the R table value. If R count is greater than R table, the item is valid. If it is smaller, the item is invalid.
What is the role of the VAR formula in the Cronbach Alpha reliability test?
-The VAR formula is used to calculate the variance for each statement item in the questionnaire. This helps in calculating the total variance needed for the Cronbach Alpha reliability test.
How do you calculate the total variance for the Cronbach Alpha test?
-To calculate the total variance, you use the VAR formula on the data set covering all respondents. The result gives the total variance needed for the Cronbach Alpha test.
How do you calculate Cronbach's Alpha value in Microsoft Excel?
-Cronbach's Alpha is calculated using the formula: n / (n - 1) * (1 - (sum of item variances / total variance)), where 'n' is the number of items in the questionnaire.
What does the 'reliable' conclusion in the Cronbach Alpha test indicate?
-A 'reliable' conclusion indicates that the questionnaire's Cronbach Alpha value is greater than 0.70, meaning the questionnaire is consistent and dependable for research purposes.
Outlines

此内容仅限付费用户访问。 请升级后访问。
立即升级Mindmap

此内容仅限付费用户访问。 请升级后访问。
立即升级Keywords

此内容仅限付费用户访问。 请升级后访问。
立即升级Highlights

此内容仅限付费用户访问。 请升级后访问。
立即升级Transcripts

此内容仅限付费用户访问。 请升级后访问。
立即升级浏览更多相关视频

🔴 Lebih Mudah! Cara Uji Validitas dan Reliabilitas Dengan Excel | Uji Validitas dan Reliabilitas

Uji Butir Soal Pilihan Ganda dengan Excel

CARA MENGUJI VALIDITAS DAN RELIABILITAS SEBUAH DATA

Cara Uji Validitas dan Reliabilitas dengan SPSS FULL

TUTORIAL SMARTPLS : UJI VALIDITAS DAN RELIABILITAS SMARTPLS
Penilian Kapabilitas, Uji Validitas dan Uji Reabilitas Cronbach Alpha di MS Excel
5.0 / 5 (0 votes)
