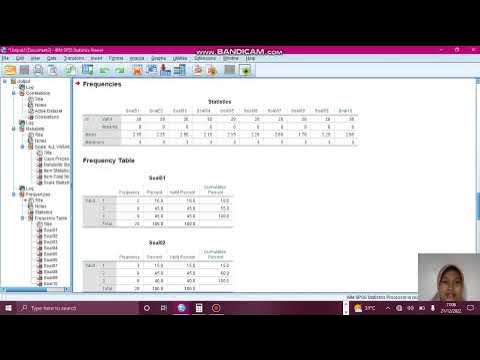
CARA MENGUJI VALIDITAS DAN RELIABILITAS SEBUAH DATA
Summary
TLDRIn this tutorial, Muhammad Wildan Jawaruddin, a student from Universitas Negeri Surabaya, demonstrates how to conduct validity and reliability tests on data using SPSS. He begins by preparing the data, showing how to export responses from Google Forms into Excel, and then transferring them to SPSS. He explains two methods for testing validity: using correlation coefficients and significance values. Next, he guides viewers through testing reliability using Cronbach's Alpha, ensuring that the survey data is reliable. The video concludes with a recap, encouraging viewers to engage with comments for further clarification.
Takeaways
- 😀 Muhammad Wildan Jawaruddin introduces himself as a student from Universitas Negeri Surabaya, providing a tutorial on testing data validity and reliability.
- 😀 The data used for the analysis was collected from 36 respondents via Google Forms.
- 😀 The first step in preparing the data involves converting the responses into Excel format and organizing it properly.
- 😀 In Excel, Wildan shows how to modify the column names and calculate totals using the SUM function for better clarity.
- 😀 The tutorial then moves to SPSS, where the Excel data is imported for further analysis.
- 😀 In SPSS, Wildan explains how to modify variable names and settings in the Variable View to enhance the data’s appearance and clarity.
- 😀 Validity testing in SPSS is conducted using two methods: comparing the R value and checking the significance value.
- 😀 For the R value method, if the calculated R value is greater than the R table value (0.329 in this case), the data is valid.
- 😀 For the significance method, if the significance value is less than 0.05, the data is considered valid.
- 😀 The next step is testing the reliability of the data using Cronbach's Alpha in SPSS, which measures internal consistency.
- 😀 A Cronbach's Alpha value higher than 0.6 (in this case, 0.924) confirms that the data is reliable.
- 😀 Wildan concludes the tutorial by inviting viewers to provide feedback or ask questions in the comments and thanking them for their attention.
Q & A
What is the first step in performing the validity test as described in the tutorial?
-The first step is to prepare the data, which involves collecting the responses and converting them into an Excel file.
How does the tutorial suggest converting the collected data into Excel format?
-The tutorial explains that you should download the data from the Google Form, choose the 'Microsoft Excel' file format, and then open the file in Excel.
What is the purpose of adjusting the column names in Excel before proceeding with the analysis?
-The column names are adjusted to ensure clarity, such as changing them to 'P1', 'P2', etc., which helps in organizing and comparing the data effectively.
What software is used for statistical analysis in this tutorial?
-SPSS software (version 25) is used for the statistical analysis in this tutorial.
What is the first method for validity testing mentioned in the tutorial?
-The first method involves checking the R-value (correlation coefficient) and comparing it to the R-table to determine validity.
How is the significance value used in validity testing?
-The significance value is compared to 0.05; if the value is less than 0.05, the item is considered valid.
What happens if the R-value calculated is greater than the R-table value?
-If the calculated R-value is greater than the R-table value, the item is deemed valid.
What does the tutorial mention about checking the reliability of data?
-The tutorial explains that to check the reliability, you need to use the 'Reliability Analysis' feature in SPSS and calculate the Cronbach's Alpha coefficient.
What is the acceptable Cronbach's Alpha value for the questionnaire to be considered reliable?
-A Cronbach's Alpha value greater than 0.6 indicates that the questionnaire is reliable.
What should be done with the data once it's transferred to SPSS?
-After transferring the data to SPSS, the tutorial advises users to make adjustments to the variable names and ensure that the data is properly formatted before starting the analysis.
Outlines

This section is available to paid users only. Please upgrade to access this part.
Upgrade NowMindmap

This section is available to paid users only. Please upgrade to access this part.
Upgrade NowKeywords

This section is available to paid users only. Please upgrade to access this part.
Upgrade NowHighlights

This section is available to paid users only. Please upgrade to access this part.
Upgrade NowTranscripts

This section is available to paid users only. Please upgrade to access this part.
Upgrade NowBrowse More Related Video

🔴 Lebih Mudah! Cara Uji Validitas dan Reliabilitas Dengan Excel | Uji Validitas dan Reliabilitas

BELAJAR UJI VALIDITAS DAN RELIABILITAS DATA PRIMER DENGAN SPSS (Bagian 1)

Dongeng tentang uji validitas Cara uji validitas spss 23, cara baca output

Cara Uji Validitas dan Reliabilitas dengan SPSS FULL

UJI VALIDITAS, RELIABILITAS, TINGKAT KESUKARAN DAN DAYA PEMBEDA SOAL TIPE URAIAN

Uji Validitas dan Reliabilitas dengan EXCEL - Uji Validitas Pearson Correlation
5.0 / 5 (0 votes)