Uji Butir Soal Pilihan Ganda dengan Excel
Summary
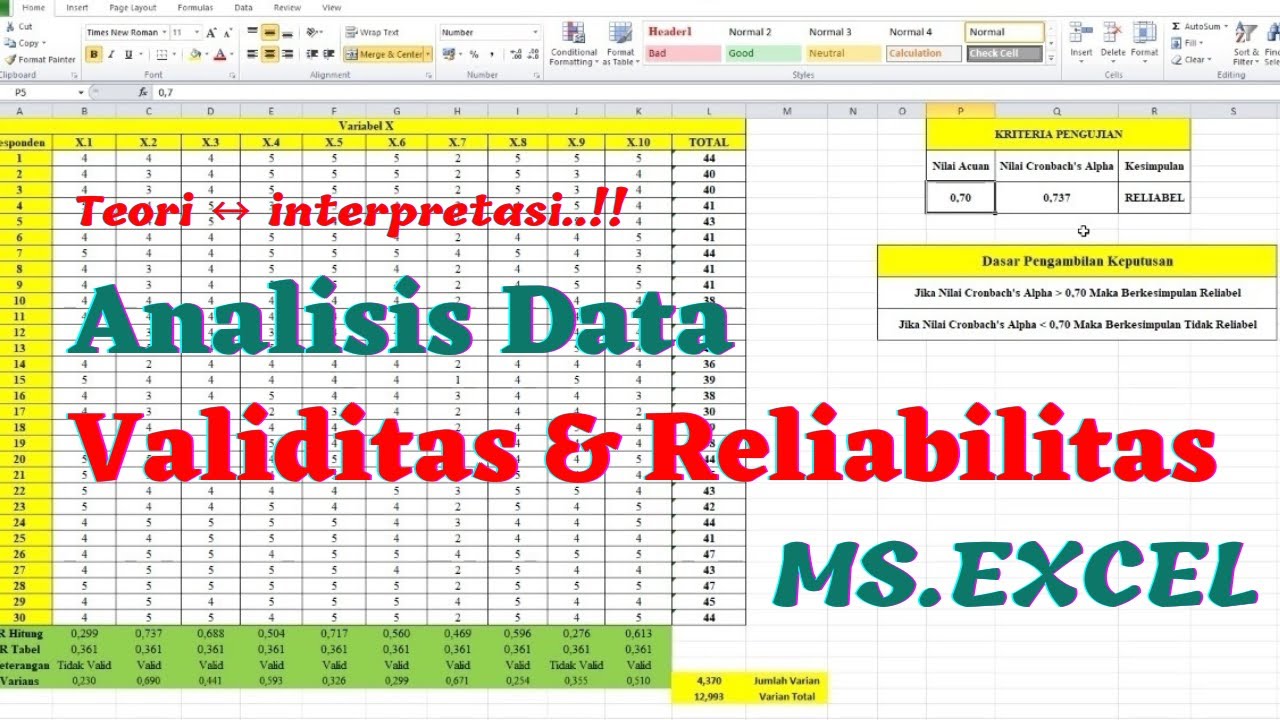
TLDRIn this tutorial, Group 1 demonstrates how to analyze multiple-choice question data using Excel, focusing on four key aspects: item validity, reliability, difficulty index, and discrimination index. The group explains step-by-step how to calculate correlation values to determine validity, assess internal consistency using Cronbach's Alpha for reliability, and categorize questions based on their difficulty. Additionally, they calculate the discrimination index by dividing students into two groups (top and bottom scorers). With clear formulas and conditional formatting, the video provides a comprehensive guide to evaluating test quality and performance.
Takeaways
- 😀 The group explains the process of testing multiple-choice question items for validity using Excel.
- 😀 To validate an item, the formula for correlation (R hitung) is used, comparing it against a threshold value (R tabel) to determine if it's valid.
- 😀 The process uses Excel functions like `Korel`, `if`, and absolute references to determine item validity across multiple questions.
- 😀 Items are categorized as 'valid' or 'invalid' based on the correlation coefficient being greater than the predefined R tabel value.
- 😀 The group then moves on to calculate the reliability of the test items using the Cronbach's alpha method, evaluating the internal consistency of the items.
- 😀 Reliability is considered acceptable if the Cronbach's alpha value is above 0.60, with values above 0.66 being more desirable.
- 😀 The difficulty index for each item is calculated by dividing the number of correct answers by the total number of students, classifying items as easy, moderate, or difficult.
- 😀 The difficulty index is used with conditional `if` formulas to categorize the questions into three categories: easy, moderate, or difficult.
- 😀 The group calculates the discrimination index by splitting students into two groups (top 10% and bottom 10%) to see how well each item differentiates between the two groups.
- 😀 Discrimination power is classified into categories like 'poor', 'good', and 'very good' based on the value calculated from the performance of the top and bottom groups.
Q & A
What is the first step in the script related to validity testing?
-The first step is calculating the correlation coefficient (R hitung) for each question. This is done by using the formula =CORREL(range of item scores, range of total scores).
How is the critical value for R (R tabel) determined?
-The critical value for R (R tabel) is determined based on the number of respondents. For 20 respondents, R tabel is calculated by subtracting 2 from the total number of respondents, resulting in R tabel for 18 respondents, which is 0.4438.
Why are dollar signs (e.g., $) used in the formula when dragging cells in Excel?
-Dollar signs are used to make the reference absolute, so that when the formula is dragged across cells, the reference to the R tabel value remains fixed and does not change.
What formula is used to check whether a question is valid or invalid?
-The formula used is =IF(R calculated > R tabel, 'valid', 'invalid'). This compares the R hitung value to R tabel and labels the question as valid if R hitung is greater.
How do you calculate the total variance and item variance for reliability testing?
-Total variance is calculated using the formula =VAR.P(range of total scores), and item variance for each question is calculated using =VAR.P(range of individual item scores).
What is the significance of Cronbach’s alpha in the script?
-Cronbach's alpha is used to determine the reliability of the test. A value greater than 0.60 indicates that the test is reliable, while a value below 0.60 suggests that the test is unreliable.
What formula is used to calculate Cronbach's alpha?
-The formula for Cronbach’s alpha is = (N / (N - 1)) * (1 - (Sum of item variances / total variance)), where N is the number of items in the test.
How is the difficulty index of the questions calculated?
-The difficulty index is calculated using the formula = (Number of correct answers / Total number of students). This measures the proportion of students who answered each question correctly.
What are the difficulty levels of the questions based on the difficulty index?
-The questions are categorized as follows: 'Difficult' for a difficulty index between 0.00 and 0.30, 'Medium' for an index between 0.31 and 0.70, and 'Easy' for an index between 0.71 and 1.00.
What is the purpose of calculating the discriminating power of the questions?
-The discriminating power is used to evaluate how well the questions differentiate between higher and lower-performing students. It is calculated by comparing the scores of the top and bottom 10% of students.
Outlines

This section is available to paid users only. Please upgrade to access this part.
Upgrade NowMindmap

This section is available to paid users only. Please upgrade to access this part.
Upgrade NowKeywords

This section is available to paid users only. Please upgrade to access this part.
Upgrade NowHighlights

This section is available to paid users only. Please upgrade to access this part.
Upgrade NowTranscripts

This section is available to paid users only. Please upgrade to access this part.
Upgrade NowBrowse More Related Video

Cara Menghitung Tingkat Kesukaran & Daya Pembeda Soal di Excel
validitas, reliabilitas, tingkat kesukaran dan daya pembeda menggunakan aplikasi SPSS 26.
UJI VALIDITAS, RELIABILITAS, TINGKAT KESUKARAN DAN DAYA PEMBEDA SOAL TIPE URAIAN

ANALISIS BUTIR SOAL (TINGKAT KESUKARAN)
Uji Validitas dan Reliabilitas dengan EXCEL - Uji Validitas Pearson Correlation

These are the ONLY 15 functions you need to know in Excel (to get most things done)
5.0 / 5 (0 votes)