Data & Diagram [Part 5] - Menyajikan Data pada Diagram Batang
Summary
TLDRIn this educational video, Pak Beni introduces bar charts as a method of data visualization. He explains how to present data clearly using bar charts, emphasizing important aspects such as consistent scaling, labeling, and clear presentation. Through examples, viewers learn how to translate raw data into a visual format and interpret it effectively. Pak Beni also guides viewers in answering questions based on data presented in bar charts, encouraging practice for better analytical skills. The video concludes with a teaser for the next lesson on pie charts.
Takeaways
- 😀 Bar charts (diagram batang) are a visual representation of data using bars of varying heights to make the data easier to understand.
- 😀 The main objective of this lesson is for viewers to understand how to present data in a bar chart and interpret it correctly.
- 😀 The process of collecting data, from planning to recording and sampling, has been covered in previous lessons, which is foundational to creating accurate bar charts.
- 😀 Bar charts are effective for presenting data in a simple and attractive way, helping people easily interpret and analyze information.
- 😀 Key features of a bar chart include consistent bar width, equal spacing between bars, and labeling both axes and the chart itself for clarity.
- 😀 The x-axis typically represents the categories (such as types of fruit), while the y-axis shows the quantity or frequency of data (like the number of students who prefer each fruit).
- 😀 It’s important to use clear labels for each bar and to give the chart a descriptive title, such as 'Favorite Fruits' in the example provided.
- 😀 The scale on the y-axis should be consistent, using intervals like 1, 2, 3, etc., or 2, 4, 6 for larger data sets.
- 😀 When analyzing bar charts, viewers can answer specific questions based on the data, such as how many people belong to a certain category.
- 😀 Practicing interpreting bar charts and answering related questions improves one's ability to analyze and draw conclusions from data.
- 😀 In the next video, the focus will shift to pie charts (diagram lingkaran), continuing the series on data presentation methods.
Q & A
What is the main purpose of the video?
-The main purpose of the video is to explain how to present data using bar charts, and how to answer questions based on data shown in a bar chart.
What are the learning objectives of this video?
-After watching the video, viewers are expected to understand what a bar chart is, how to present data using a bar chart, and how to answer questions based on the data shown in the chart.
What steps in data collection were mentioned in the video?
-The steps in data collection mentioned in the video include planning data collection, formulating questions, recording data, and determining the sample.
Why is it important to present data visually?
-Presenting data visually, such as using diagrams, makes it easier for people to understand the data, and helps to communicate information more clearly and effectively.
What is a bar chart?
-A bar chart is a graphical representation of data using bars, where the height of each bar corresponds to the value of the data point it represents.
What key elements should be considered when drawing a bar chart?
-Key elements include making sure the bars have equal width, ensuring consistent spacing between bars, labeling each bar to indicate what it represents, adding a title to the chart, and labeling the axes for clarity.
What should be labeled on a bar chart?
-The bar chart should have labels on the bars (e.g., types of fruit in the example), a title (e.g., 'Favorite Fruits'), and labels on the axes (e.g., 'Fruit' on the x-axis and 'Number of Students' on the y-axis).
How should the scale of a bar chart be represented?
-The scale on the y-axis should be consistent, with intervals such as 1, 2, 3, 4 or 2, 4, 6, 8, depending on the data. Consistency is key to making the chart easy to read.
In the example of favorite fruits, how can we interpret the data from the bar chart?
-By looking at the height of the bars, we can determine how many students like each type of fruit. For instance, if the 'apple' bar is higher than the 'banana' bar, it indicates that more students prefer apples over bananas.
How do you determine the number of people in each data group in the bar chart example?
-You can determine the number of people in each data group by counting the number of people represented by the height of the bars. For example, a bar representing 10-19 messages sent would show the number of people within that range, which in the video example is 12.
Outlines

此内容仅限付费用户访问。 请升级后访问。
立即升级Mindmap

此内容仅限付费用户访问。 请升级后访问。
立即升级Keywords

此内容仅限付费用户访问。 请升级后访问。
立即升级Highlights

此内容仅限付费用户访问。 请升级后访问。
立即升级Transcripts

此内容仅限付费用户访问。 请升级后访问。
立即升级浏览更多相关视频
Statistika Kelas 8 [Part 1] - Menganalisis Data

Statistika Kelas 8 [Part 3] - Menentukan Median dan Modus Suatu Data
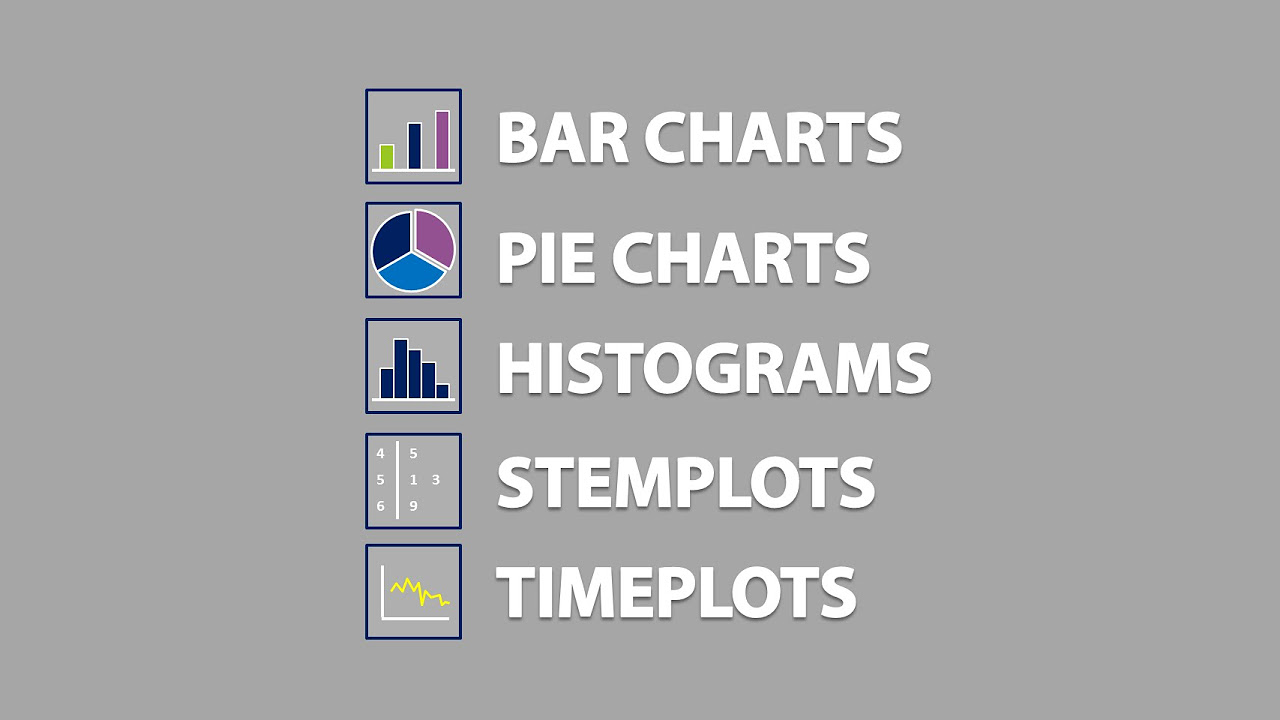
Bar Charts, Pie Charts, Histograms, Stemplots, Timeplots (1.2)

Data & Diagram [Part 1] - Merencanakan Pengumpulan Data

TOP 5 Excel Data Visualization Tips (Become a Data Visualization PRO)

DataVis Pod 01
5.0 / 5 (0 votes)
