Statistika Kelas 8 [Part 3] - Menentukan Median dan Modus Suatu Data
Summary
TLDRIn this video, Pak Beni explains how to calculate the median and mode of a dataset. He walks viewers through the concepts and provides examples, starting with the process of determining the median for both odd and even datasets. Pak Beni also covers how to find the mode, emphasizing that it’s the most frequent data point, and how a dataset can have one, multiple, or no modes. Additionally, he demonstrates how to apply these concepts to real-world data, including frequency tables and bar charts. The video concludes with practice problems to help reinforce learning.
Takeaways
- 😀 Understanding the median: It represents the middle value in a set of data after it has been sorted.
- 😀 For odd-numbered data, the median is the value in the middle position.
- 😀 For even-numbered data, the median is calculated by averaging the two middle values.
- 😀 The concept of the mode: The mode is the value that appears most frequently in a dataset.
- 😀 A dataset can have no mode, one mode, or multiple modes if different values appear with the same frequency.
- 😀 When there are multiple modes, the dataset is considered bimodal or multimodal.
- 😀 In a dataset where all values appear the same number of times, there is no mode.
- 😀 In cases with grouped data (such as frequency tables), formulas and calculations can be used to find the median more efficiently.
- 😀 Median calculation can also be done manually by checking the cumulative frequency in a frequency table.
- 😀 The mode is determined by looking for the value with the highest frequency in a dataset, regardless of how other values appear.
- 😀 The mode and median may not always be the same, as they focus on different aspects of the data's distribution.
Q & A
What is the purpose of this video?
-The video aims to explain how to determine the median and mode of a dataset, helping viewers understand these concepts clearly and apply them to data problems.
How do you find the median in a dataset with an odd number of values?
-When the dataset has an odd number of values, the median is simply the value that lies in the middle when the data is sorted in ascending order.
What do you do if the dataset has an even number of values?
-If the dataset has an even number of values, the median is calculated by averaging the two middle values after sorting the data.
What happens when the dataset has no mode?
-If no value appears more than once in the dataset, it is said to have no mode.
How is the mode of a dataset determined?
-The mode is the value that appears most frequently in the dataset. If multiple values have the highest frequency, the dataset has more than one mode.
What happens if a dataset has two modes?
-A dataset with two modes is called bimodal, as it has two values that appear with the highest frequency.
How do you calculate the median of a dataset with a large number of data points?
-For a large dataset, the median can be calculated more efficiently using a formula rather than sorting all the values manually.
What is the difference between median and mode?
-The median is the middle value of a dataset when ordered, whereas the mode is the value that appears most frequently in the dataset. They are different measures of central tendency.
How do you calculate the median for a frequency distribution?
-To calculate the median in a frequency distribution, sum the frequencies to find the total number of data points, then use the position formula to determine the median's value from the cumulative frequencies.
In the given example, what was the median of the singing scores when there were 9 data points?
-When there were 9 data points, the median was the middle value, which was 135.
Outlines

This section is available to paid users only. Please upgrade to access this part.
Upgrade NowMindmap

This section is available to paid users only. Please upgrade to access this part.
Upgrade NowKeywords

This section is available to paid users only. Please upgrade to access this part.
Upgrade NowHighlights

This section is available to paid users only. Please upgrade to access this part.
Upgrade NowTranscripts

This section is available to paid users only. Please upgrade to access this part.
Upgrade NowBrowse More Related Video
Statistika Kelas 8 [Part 4] - Menentukan Jangkauan, Kuartil, dan Jangkauan Interkuartil

Ukuran Pemusatan Data Modus Median dan Rata rata

mean median modus data tunggal dalam bentuk tabel

Pola Bilangan [Part 1] - Mengenal Pola Bilangan
Statistics intro: Mean, median, and mode | Data and statistics | 6th grade | Khan Academy
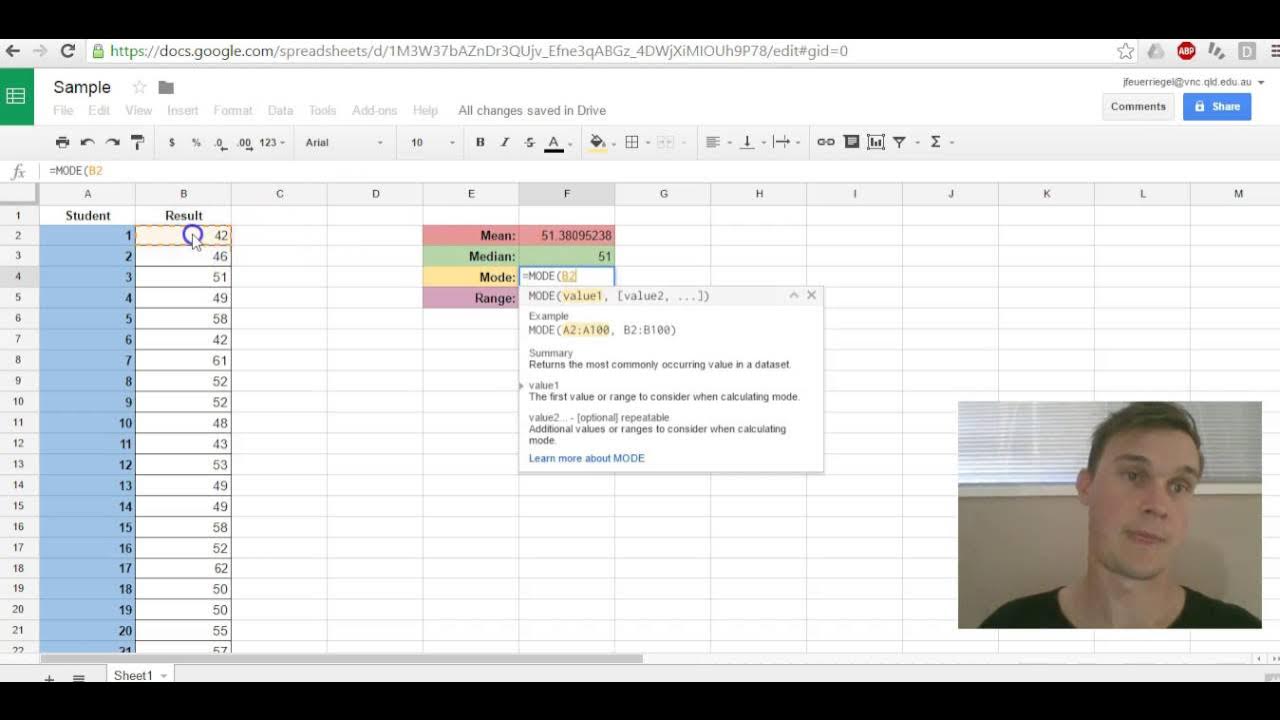
Google Sheets Mean,Median,Mode,Range
5.0 / 5 (0 votes)