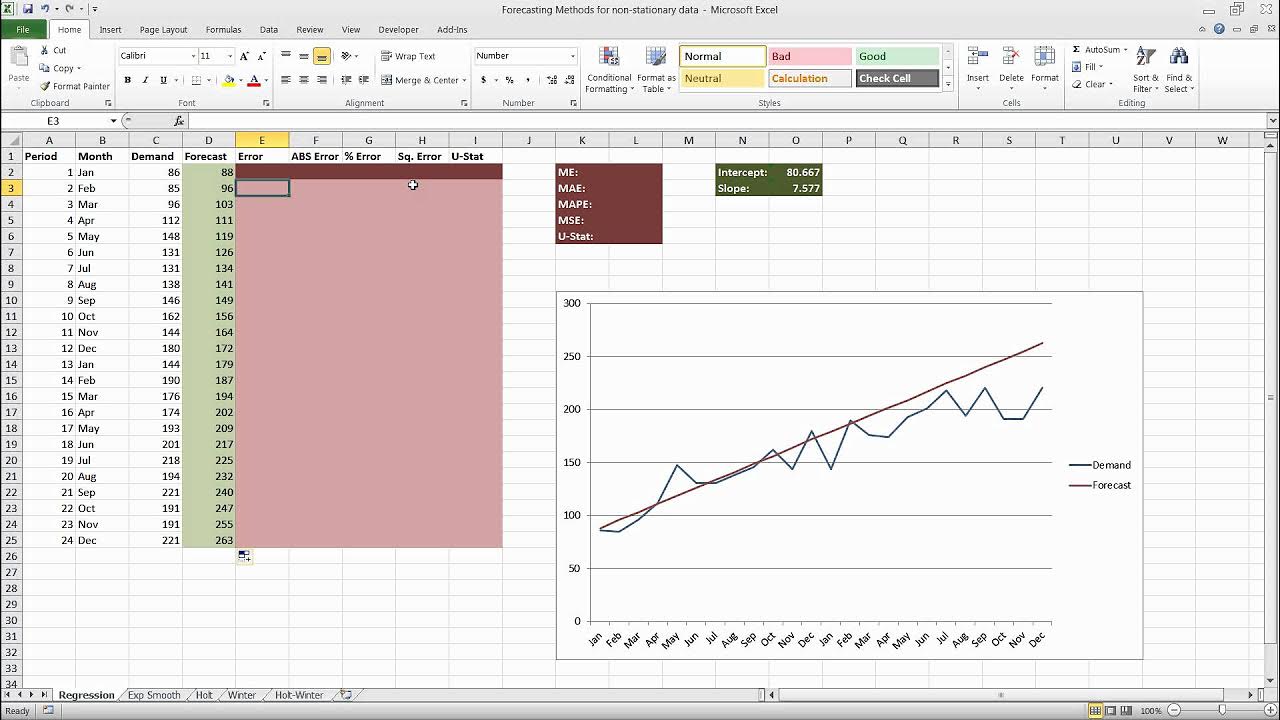
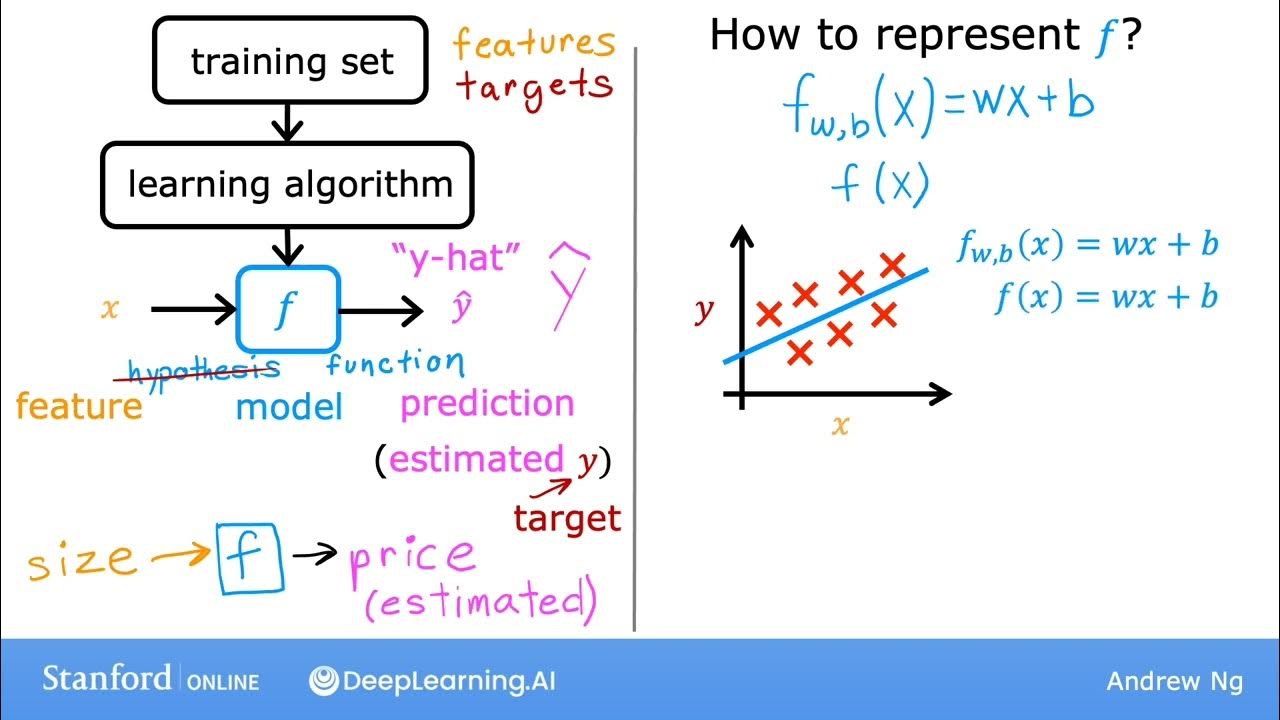
Forecasting with Excel
Summary
TLDRThis script explores Excel's 'Forecast' function, which performs linear regression to predict future values. Using a height and weight dataset, the tutorial demonstrates converting units to metric, plotting data, and applying the function to estimate weights for given heights. It compares 'Forecast' and 'Trend' functions and highlights their limitations with non-linear data, such as traffic patterns. The script suggests 'Forecast.ETS' for cyclical data, illustrating its application with a traffic dataset to show improved predictions over linear methods.
Takeaways
- 📊 The 'FORECAST' function in Excel performs a linear regression to predict future values based on existing data trends.
- 📈 'FORECAST.LINEAR' is a synonym for 'FORECAST' and they both use the same linear regression method for predictions.
- 📈 The script uses a height and weight dataset from Google to demonstrate the 'FORECAST' function, converting units from inches and pounds to metric for easier understanding.
- 📊 To visualize the data, a scatter plot is used to show the relationship between height and weight, indicating a roughly linear increase in weight with height.
- 🔢 The 'FORECAST' function requires known Y values (dependent variable) and known X values (independent variable) to make predictions.
- 🤔 The script highlights the limitations of linear regression when dealing with data that has seasonal patterns, such as traffic data, which shows spikes and trends that a linear model cannot accurately predict.
- 📉 The 'TREND' function is introduced as an alternative to 'FORECAST', which can handle arrays of X values for predictions, but it also suffers from the same limitations with non-linear data.
- 🔄 The script points out that 'FORECAST', 'FORECAST.LINEAR', and 'TREND' functions are also available in Google Sheets, allowing for easy data manipulation across platforms.
- 🔄 The 'FORECAST.ETS' function is introduced for handling cyclical data, allowing for the inclusion of seasonality in predictions, which is more suitable for data with patterns that repeat over regular intervals.
- 📅 'FORECAST.ETS' requires specifying the seasonality period, or it will attempt to determine it automatically, and can handle missing values by interpolation or by setting them to zero.
- 📈 The script concludes that for non-linear and seasonal data, 'FORECAST.ETS' provides better predictions than simple linear regression, although it's not as advanced as some specialized forecasting tools.
Q & A
What does the Excel function 'FORECAST' do?
-The 'FORECAST' function in Excel performs a linear regression analysis on a dataset and uses the resulting model to predict future values based on the trend of the input data.
What is the synonym for the 'FORECAST' function in Excel?
-The 'FORECAST.LINEAR' function is a synonym for the 'FORECAST' function, and they perform the same linear regression analysis for prediction purposes.
What type of data set is used in the script to demonstrate the 'FORECAST' function?
-The script uses a height and weight dataset from Google, containing measurements for about 25,000 people in inches and pounds, which is then converted to centimeters and kilograms.
How is height converted from inches to centimeters in the script?
-To convert height from inches to centimeters, the height in inches is multiplied by 2.54.
What is the approximate formula used to convert weight from pounds to kilograms in the script?
-The script uses a formula where weight in pounds is divided by approximately 2.204 to convert it to kilograms.
How does the script visualize the relationship between height and weight?
-The script visualizes the relationship between height and weight using a scatter plot, which shows how weight varies with height.
What is the predicted weight for a person who is 170 cm tall according to the 'FORECAST' function in the script?
-According to the 'FORECAST' function in the script, a person who is 170 cm tall is predicted to weigh about 56 kg.
How does the 'TREND' function in Excel differ from the 'FORECAST' function?
-The 'TREND' function is similar to 'FORECAST' in that it also performs linear regression, but it can be used to predict multiple future values at once by passing an array of new X values.
Why might a linear regression model not be suitable for all types of data?
-A linear regression model might not be suitable for data that exhibits non-linear patterns or seasonality, as it assumes a straight-line relationship between variables.
What is the 'forecast.ETS' function in Excel, and when is it more appropriate to use than 'FORECAST'?
-The 'forecast.ETS' function in Excel is used for time series data that has a seasonal pattern. It is more appropriate to use when the data shows cyclical behavior, as it can better capture the seasonality compared to a simple linear model.
How does the 'forecast.ETS' function handle seasonality in data?
-The 'forecast.ETS' function can explicitly specify seasonality through a parameter, or it can automatically detect the seasonality in the data. It then uses this information to make predictions that account for the seasonal fluctuations.
Outlines

此内容仅限付费用户访问。 请升级后访问。
立即升级Mindmap

此内容仅限付费用户访问。 请升级后访问。
立即升级Keywords

此内容仅限付费用户访问。 请升级后访问。
立即升级Highlights

此内容仅限付费用户访问。 请升级后访问。
立即升级Transcripts

此内容仅限付费用户访问。 请升级后访问。
立即升级浏览更多相关视频

Forecasting in Excel Using Simple Linear Regression

Lec-5: Logistic Regression with Simplest & Easiest Example | Machine Learning

Regression Lecture

#10 Machine Learning Specialization [Course 1, Week 1, Lesson 3]

Gráfico de dispersão no Excel

Relation between solution of linear regression and ridge regression
5.0 / 5 (0 votes)
