Regression Lecture
Summary
TLDRIn this lesson on linear regression, the instructor explains how to find the regression line equation, predict y-values, and calculate residuals. The regression line is described as the best-fit line, minimizing the difference between predicted and observed values. The process includes calculating the slope (m) and y-intercept (b) using formulas, and applying them to predict values within the data's range. Tools like Excel and Minitab are introduced for regression analysis. The instructor also highlights the importance of understanding the relationship between variables and predicts future outcomes, urging students to solve related exercises for better practice.
Takeaways
- 😀 The lesson focuses on linear regression, which is used to predict the value of a dependent variable (y) based on the value of an independent variable (x).
- 😀 Linear regression is a continuation of the concept of correlation, and the goal is to find the equation of the regression line.
- 😀 A regression line is used to predict the y value for a given x value within the data range.
- 😀 The residuals, or the difference between the observed and predicted y values, help assess the accuracy of the regression model.
- 😀 The regression line minimizes the sum of the squares of the residuals, ensuring the best fit for the data.
- 😀 The equation of the regression line is represented as y = mx + b, where m is the slope, b is the y-intercept, and y is the predicted value for x.
- 😀 To calculate the slope (m) and y-intercept (b), summations of x, y, x^2, and x*y are used in the formulas.
- 😀 The lecture also discusses the importance of software tools like Excel and Minitab, which can help perform regression analysis and display the results directly.
- 😀 Predictions using the regression line should only be made within the range of x values in the data set. Values outside this range may not be accurate.
- 😀 The students are asked to solve an exercise from the provided e-book, focusing on plotting a regression line, calculating correlation coefficients, and testing hypotheses.
Q & A
What is the main focus of today's lesson?
-Today's lesson focuses on linear regression, including how to find the equation of the regression line and use it to predict the value of 'y' from a given 'x'.
What is the purpose of regression analysis in this context?
-The purpose of regression analysis is to determine the equation of the regression line that models the relationship between two variables, allowing predictions of one variable ('y') based on the values of another ('x').
What is a regression line?
-A regression line is the line that best fits the data points, minimizing the sum of the squared residuals, and is used to predict values of 'y' for a given 'x'.
What is a residual in regression analysis?
-A residual is the difference between the observed value of 'y' and the predicted value of 'y' (i.e., the actual observed value minus the predicted value based on the regression equation).
What does it mean if the residuals are small in a regression model?
-If the residuals are small, it indicates that the regression model is a good fit for the data, meaning the predicted values are close to the actual observed values.
What formula is used for the linear regression equation?
-The formula for the linear regression equation is 'y = mx + b', where 'm' is the slope, 'b' is the y-intercept, and 'y' is the predicted value based on 'x'.
How do you calculate the slope ('m') and y-intercept ('b') in the linear regression equation?
-The slope ('m') is calculated using a formula that involves the summation of 'x' and 'y' values, as well as the summation of 'x^2' and 'x*y'. The y-intercept ('b') is calculated using the mean values of 'x' and 'y', as well as the slope ('m').
What is the difference between simple and multiple regression?
-Simple regression involves one independent variable and one dependent variable, while multiple regression involves more than one independent variable predicting a dependent variable.
Why is it important to predict values within the range of 'x' values used in the regression model?
-It is important to predict values within the range of 'x' because the regression model is based on data within that range, and predictions outside of this range may not be accurate or meaningful.
What tools or software were mentioned for performing regression analysis?
-The tools mentioned for performing regression analysis include Excel and Minitab. Minitab directly provides the regression equation, while Excel requires manual calculation using the slope and y-intercept formulas.
Outlines

This section is available to paid users only. Please upgrade to access this part.
Upgrade NowMindmap

This section is available to paid users only. Please upgrade to access this part.
Upgrade NowKeywords

This section is available to paid users only. Please upgrade to access this part.
Upgrade NowHighlights

This section is available to paid users only. Please upgrade to access this part.
Upgrade NowTranscripts

This section is available to paid users only. Please upgrade to access this part.
Upgrade NowBrowse More Related Video
Metode Kuadrat Terkecil Hal 97-101 Bab 3 STATISTIK Kelas 11 SMA Kurikulum Merdeka

La régression linéaire, quelques explications
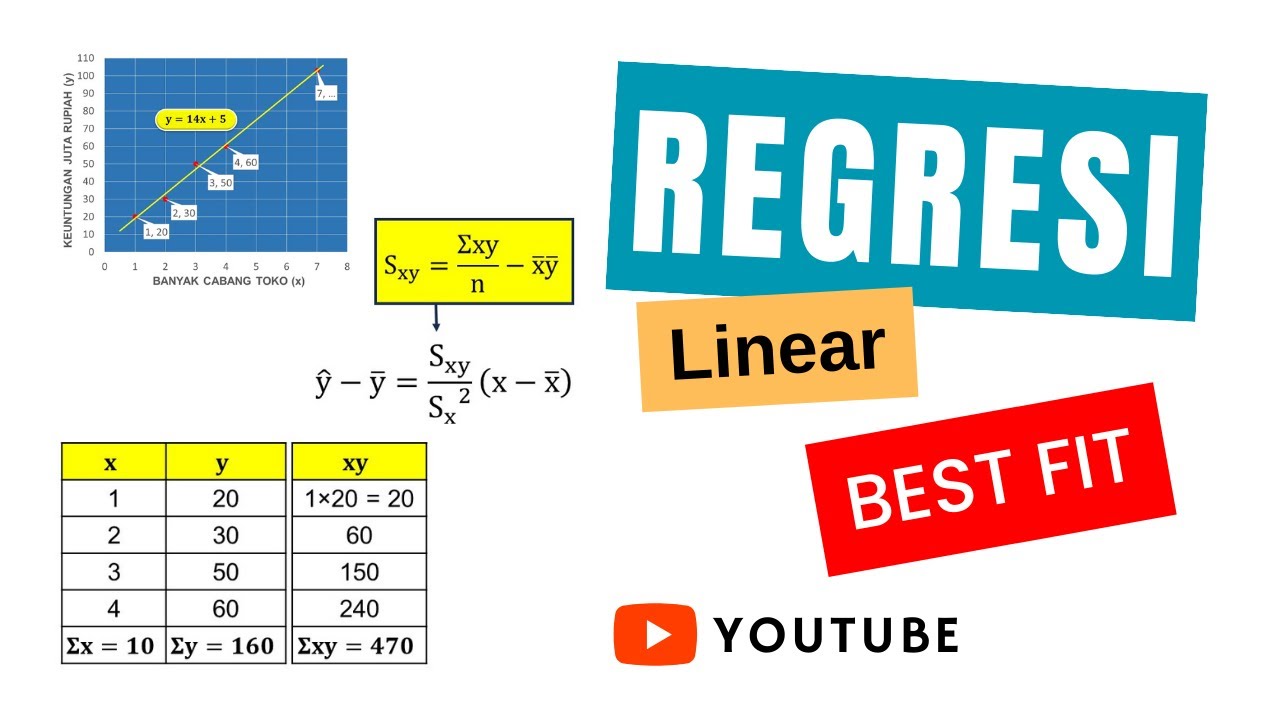
REGRESI LINEAR I Best Fit

Regresi linear, koefisien korelasi dan koefisien determinasi, by Top Mat

Regresi Linier bab Statistika Regresi MATEMATIKA kelas 11 | Matematika wajib kelas 11 kurmer

Metode Statistika | Analisis Regresi Linier | Part 1 Menentukan Persamaan Regresi
5.0 / 5 (0 votes)