PERBEDAAN STATISTIKA DESKRIPTIF DAN INFERENSIAL | Dive Deeper | Algoritma 2023
Summary
TLDRIn this video, the presenter explains the two main branches of statistics: descriptive and inferential statistics. Descriptive statistics focuses on organizing, presenting, and summarizing data using tables, graphs, and numerical parameters like mean, median, and correlation. Inferential statistics, on the other hand, helps draw conclusions about a population based on sample data, using techniques like hypothesis testing and confidence intervals. The video also highlights how these statistical methods can be used in real-life scenarios, such as understanding consumer preferences, and their importance in data science.
Takeaways
- 😀 Only 8% of people manage to stay focused on their New Year's resolutions until the end.
- 😀 The number of unemployed in Indonesia is higher than the entire population of Singapore.
- 😀 YouTube sees 500 hours of new videos uploaded every minute.
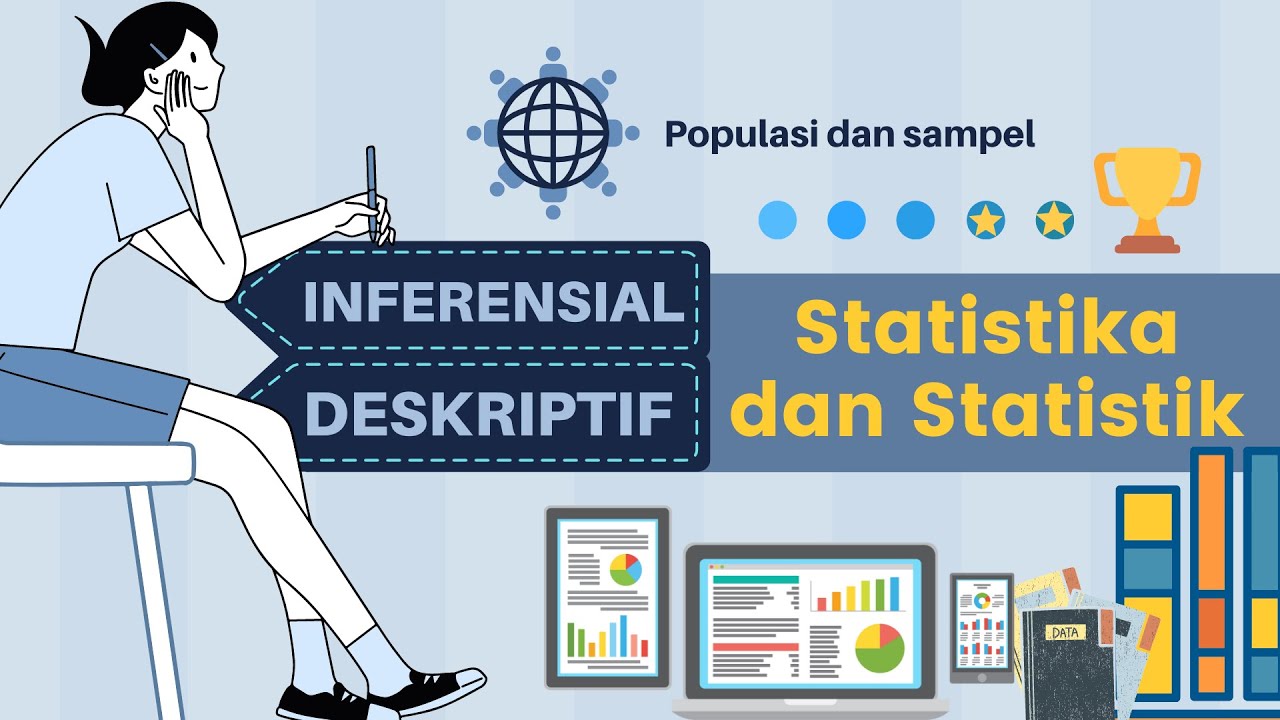
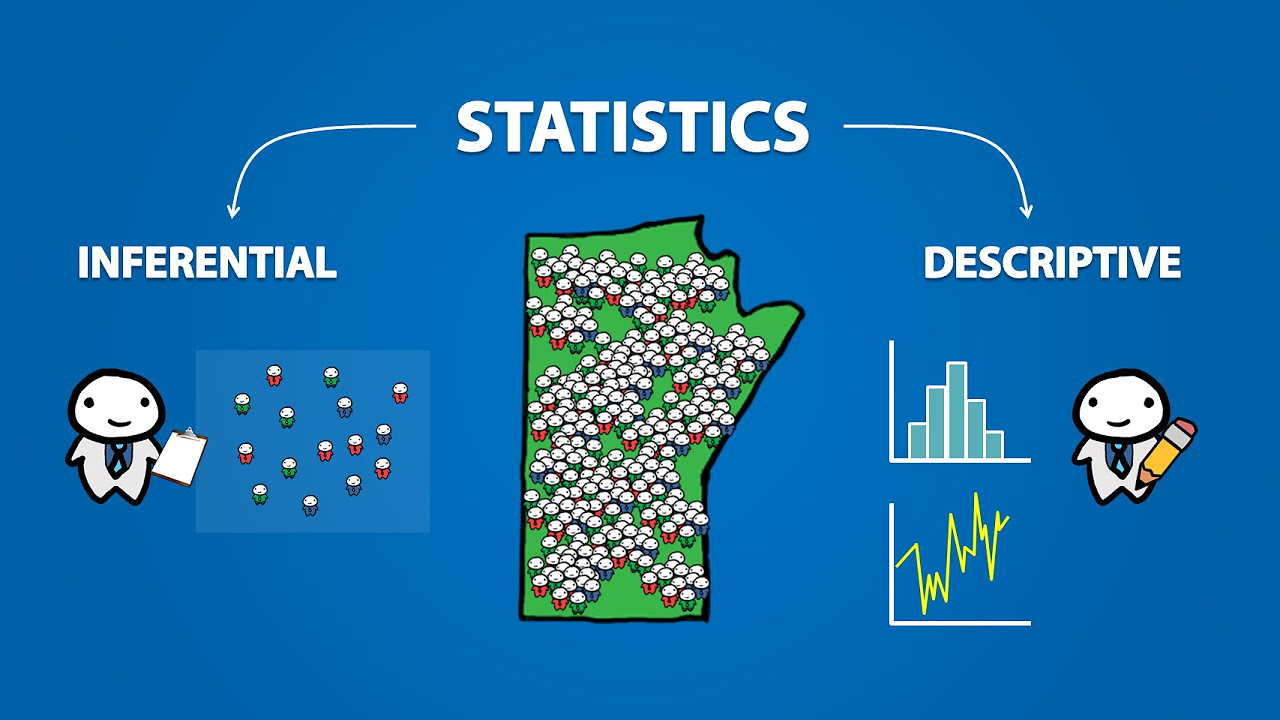
- 😀 Statistics can help us better understand the world around us and is divided into two types: descriptive and inferential statistics.
- 😀 Descriptive statistics organizes, presents, and describes datasets through tables, graphs, and numerical parameters.
- 😀 Descriptive statistics includes terms like mean, median, mode, variance, correlation, and standard deviation.
- 😀 Descriptive statistics is useful for understanding sample data but cannot be used to make conclusions about the entire population.
- 😀 Inferential statistics draws conclusions about a population based on sample data using methods like hypothesis testing and regression analysis.
- 😀 Examples of inferential statistics include using confidence intervals to estimate population parameters and conducting hypothesis tests to compare assumptions.
- 😀 A practical example: a survey of 100 people in a mall can provide descriptive statistics about shopping preferences, while inferential statistics can predict the age group of brand A's customers with a confidence level.
- 😀 Statistics is a powerful tool for data scientists to interpret data and can be applied to various fields, including data science and physics.
Q & A
What is the main difference between descriptive statistics and inferential statistics?
-Descriptive statistics is used to organize, present, and describe data sets using various tools like tables, graphs, and numerical parameters. It helps summarize the data, but it cannot be used to make conclusions about a larger population. In contrast, inferential statistics uses sample data to draw conclusions or make predictions about a population.
What are the six statistical terms included in descriptive statistics?
-The six statistical terms are: 1) Mean (average value), 2) Median (middle value), 3) Mode (the most frequently occurring value), 4) Variance (average of the squared differences from the mean), 5) Correlation (relationship between two numerical variables), and 6) Range (the difference between the maximum and minimum values).
Can descriptive statistics be used to draw conclusions about a population?
-No, descriptive statistics only helps to summarize and describe a data set. It cannot be used to generalize conclusions about a larger population, which is where inferential statistics comes into play.
What role does inferential statistics play in research?
-Inferential statistics is used to make inferences about a population based on sample data. It allows researchers to draw conclusions, make predictions, and test hypotheses about a population's characteristics.
How does hypothesis testing work in inferential statistics?
-Hypothesis testing in inferential statistics involves comparing two opposing hypotheses to determine which is more likely to be true based on the sample data. The test helps in making decisions about the population's characteristics.
What is the importance of the confidence interval in inferential statistics?
-The confidence interval provides an estimated range of values that is likely to contain the true population parameter. It is used to quantify the uncertainty in estimating population characteristics from sample data.
Can you give an example of how descriptive statistics might be used in practice?
-For example, if you survey 100 people in a mall about whether they like shopping at a specific brand, the results can be summarized in a table or chart. This is descriptive statistics in action.
How does inferential statistics enhance decision-making for businesses?
-Inferential statistics helps businesses make more informed decisions by providing insights into the likelihood of certain outcomes. For instance, understanding the age range of customers can help a brand target its resources more effectively, as demonstrated in the example where there is a 95% chance that the majority of visitors are between 16 and 25 years old.
What type of data analysis is typically used for predicting relationships between variables?
-Linear regression analysis is commonly used to predict relationships between dependent and independent variables. It helps in determining the strength and nature of the relationship between variables.
Why is it important for data scientists to understand both descriptive and inferential statistics?
-Understanding both descriptive and inferential statistics allows data scientists to not only summarize and present data effectively but also to make predictions, draw conclusions, and test hypotheses based on sample data, which is crucial for data-driven decision-making.
Outlines

This section is available to paid users only. Please upgrade to access this part.
Upgrade NowMindmap

This section is available to paid users only. Please upgrade to access this part.
Upgrade NowKeywords

This section is available to paid users only. Please upgrade to access this part.
Upgrade NowHighlights

This section is available to paid users only. Please upgrade to access this part.
Upgrade NowTranscripts

This section is available to paid users only. Please upgrade to access this part.
Upgrade Now


5.0 / 5 (0 votes)