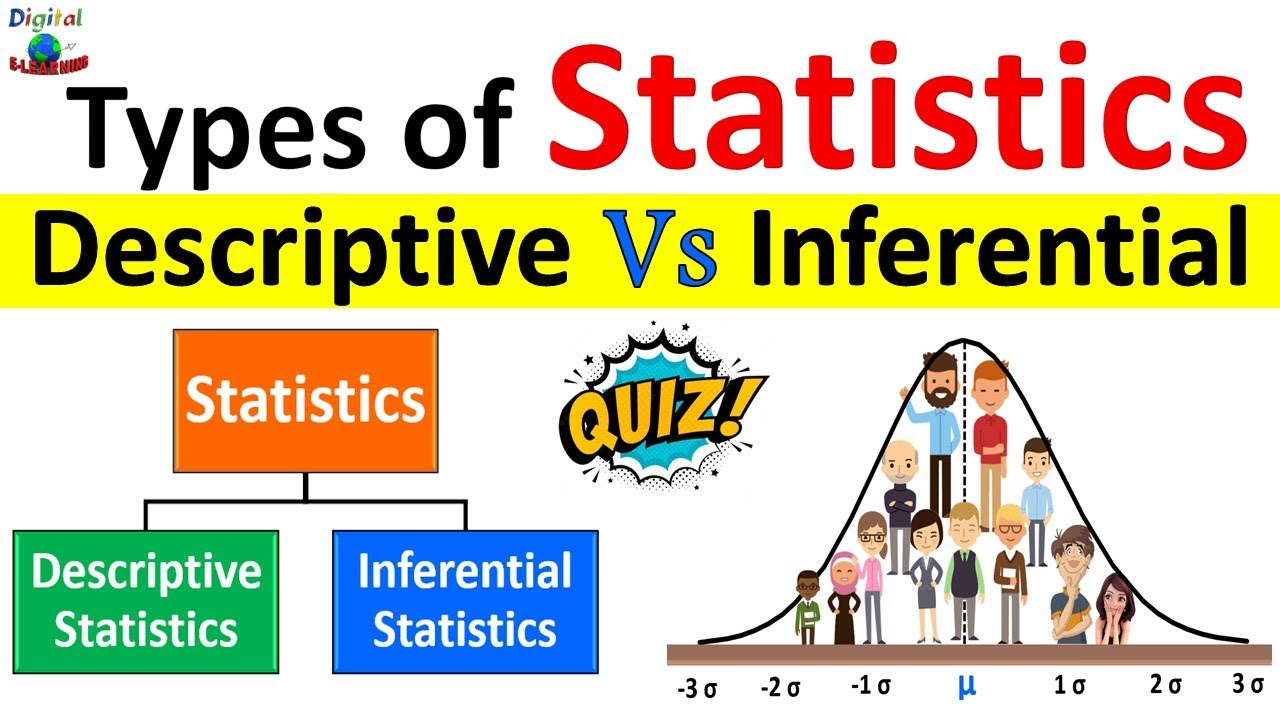
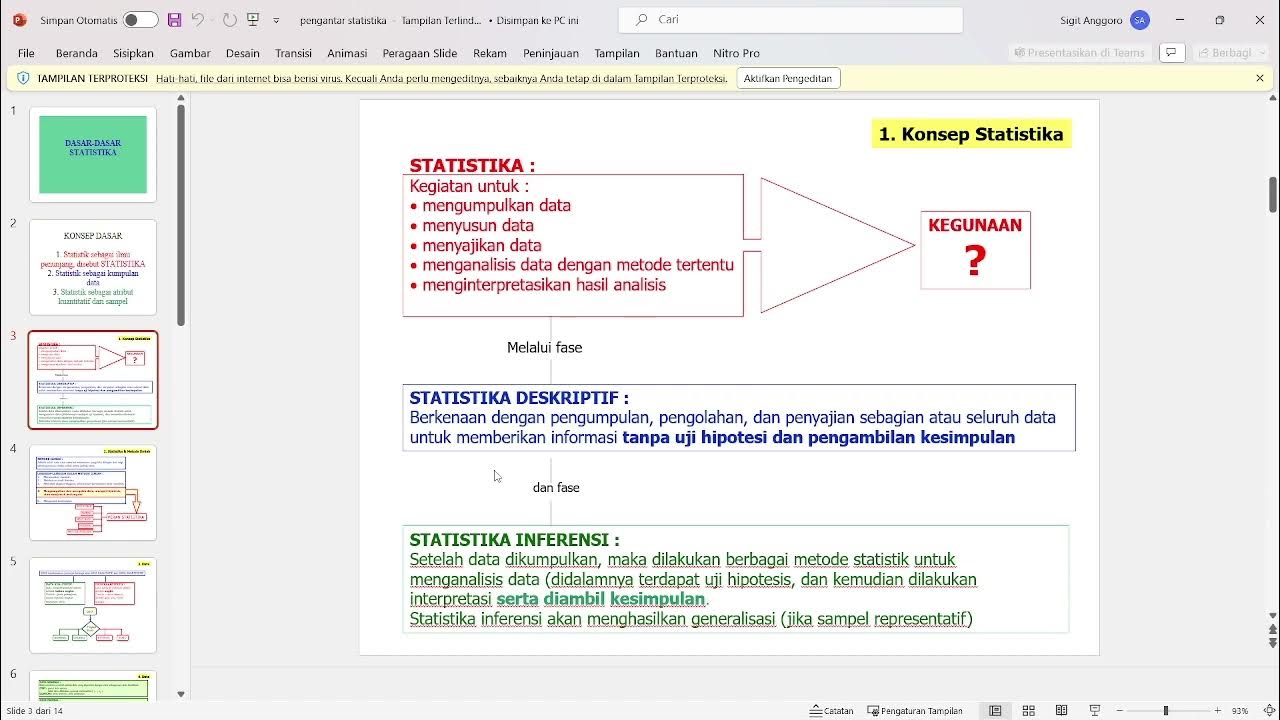
Statistik Inferensial & Hipotesis
Summary
TLDRIn this video, the presenter discusses the difference between descriptive statistics and inferential statistics, with a focus on hypothesis testing. Descriptive statistics only describe data characteristics, while inferential statistics allow for conclusions about a population. The presenter explains the concept of hypotheses, including null and alternative hypotheses, and how they relate to research questions. The video also covers the concepts of significance level and confidence level in statistical analysis. It emphasizes the importance of understanding these concepts before diving into more complex calculations and statistical tools.
Takeaways
- 😀 Descriptive statistics only summarize data and cannot make conclusions about a larger population.
- 😀 Inferential statistics allow conclusions about a population based on sample data, incorporating probability.
- 😀 Hypothesis testing involves testing a temporary assumption (hypothesis) that must be proven with data.
- 😀 The null hypothesis (H0) assumes no relationship or effect, while the alternative hypothesis (H1) assumes there is a relationship or effect.
- 😀 In hypothesis testing, the null hypothesis is considered true until proven otherwise through data analysis.
- 😀 Example: A null hypothesis for teachers’ salaries might suggest no relationship with productivity, while the alternative hypothesis suggests a relationship exists.
- 😀 The significance level (α) is the probability of making an error when rejecting the null hypothesis, typically set at 5%.
- 😀 A 5% significance level indicates a 5% chance of incorrectly rejecting the null hypothesis.
- 😀 Confidence level is the inverse of significance level. For a 5% significance level, the confidence level is 95%.
- 😀 Understanding statistical concepts, despite their complexity, is vital for drawing valid conclusions from research data.
Q & A
What is the difference between descriptive statistics and inferential statistics?
-Descriptive statistics summarize and describe the characteristics of a dataset, while inferential statistics use sample data to make conclusions or predictions about a larger population.
Why can't descriptive statistics be used to make conclusions about a population?
-Descriptive statistics only focus on summarizing data from a given sample, without any inference or prediction about the broader population.
What is a hypothesis in research, and how is it formed?
-A hypothesis is a temporary answer to a research problem that must be tested with data. It is usually based on existing theories or prior research.
What are the two types of hypotheses mentioned in the video?
-The two types of hypotheses are the null hypothesis (H₀), which assumes no effect or relationship, and the alternative hypothesis (H₁), which assumes a relationship or effect exists.
What does the null hypothesis (H₀) represent?
-The null hypothesis (H₀) represents the assumption that there is no relationship or effect between the variables being studied.
What is the role of hypothesis testing in research?
-Hypothesis testing helps determine whether to accept or reject the null hypothesis based on sample data. It evaluates if the observed data provides enough evidence to support the alternative hypothesis.
What is the significance level (α), and how does it relate to hypothesis testing?
-The significance level (α) represents the probability of making a mistake when rejecting the null hypothesis. A common value used is 5%, indicating a 5% chance of error in the conclusion.
How does the confidence level relate to the significance level?
-The confidence level is the complement of the significance level. If the significance level is 5%, the confidence level is 95%, meaning there's a 95% likelihood that the conclusion is correct.
What is the practical example used to explain hypothesis testing in the video?
-The video uses the example of testing whether there is a relationship between teachers' salaries and their work productivity, or whether there is a difference in academic performance between students who attend tutoring and those who don't.
Why do some students find statistical calculations and SPSS challenging?
-Statistical calculations, particularly when using software like SPSS, can be difficult for some students because they often involve complex calculations and a strong understanding of statistical concepts.
Outlines

This section is available to paid users only. Please upgrade to access this part.
Upgrade NowMindmap

This section is available to paid users only. Please upgrade to access this part.
Upgrade NowKeywords

This section is available to paid users only. Please upgrade to access this part.
Upgrade NowHighlights

This section is available to paid users only. Please upgrade to access this part.
Upgrade NowTranscripts

This section is available to paid users only. Please upgrade to access this part.
Upgrade NowBrowse More Related Video

Descriptive Statistics vs Inferential Statistics | Measure of Central Tendency | Types of Statistics

Statisitik ke 3-1

PERBEDAAN STATISTIKA DESKRIPTIF DAN INFERENSIAL | Dive Deeper | Algoritma 2023

What is Statistics? A Beginner's Guide to Statistics (Data Analytics)!

PERBEDAAN STATISTIK DESKRIPTIF DAN INFERENSIAL

Statistik Inferensial
5.0 / 5 (0 votes)