Market Structure Explained – Stop Trading Blind
Summary
TLDRIn this video, the speaker addresses the importance of correctly reading market structure in trading, focusing on key concepts like swing highs and lows, uptrends, downtrends, breaks of structure (BOS), and change of character (CHO). Common trading mistakes such as trading against the structure, entering on weak pullbacks, and ignoring higher time frames are discussed. The speaker emphasizes the need for multi-timeframe analysis and shares insights on using indicators like 'happy trail' to enhance confidence in trading decisions. The video aims to guide traders in better understanding market behavior and improving their trade execution.
Takeaways
- 😀 Market structure is the roadmap for price movement and is essential for successful trading.
- 😀 To understand market structure, always identify the recent swing high and low first.
- 😀 A simple way to identify the trend is by zooming out to see the overall direction of the market.
- 😀 Only trade in the direction of the current structure, and avoid entering during transitional phases.
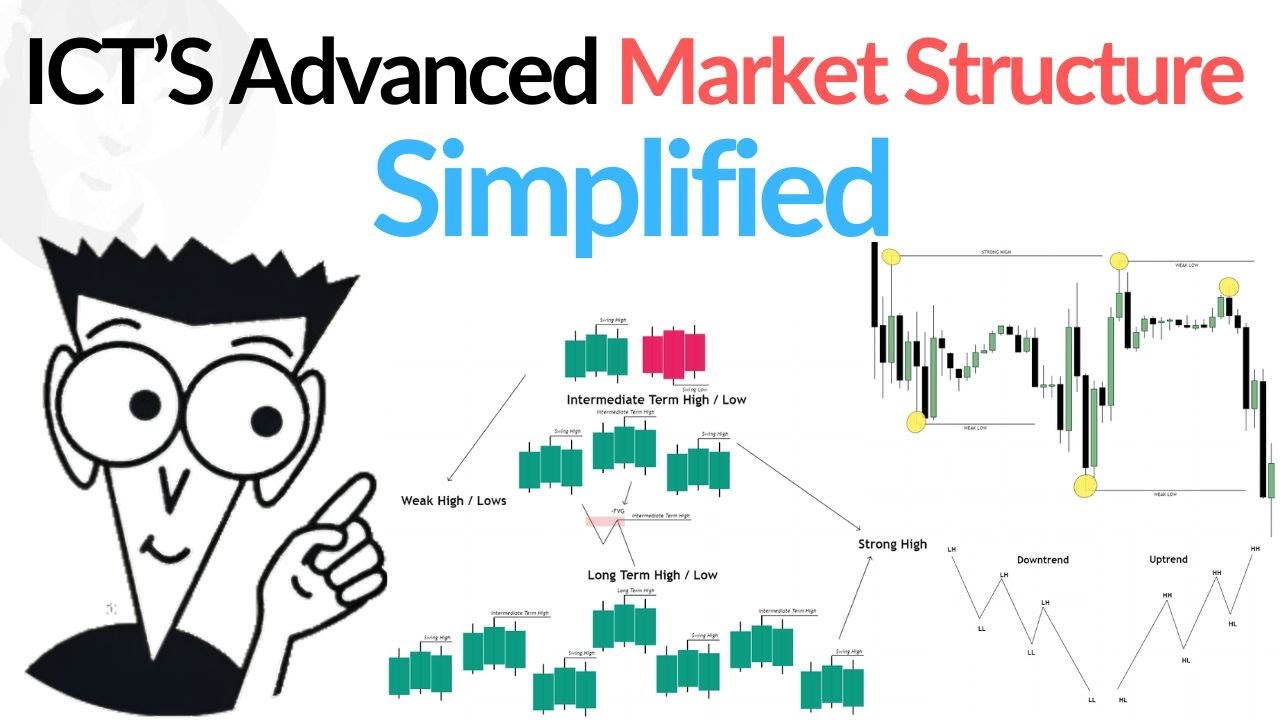
- 😀 An uptrend is marked by higher highs and higher lows, while a downtrend is marked by lower highs and lower lows.
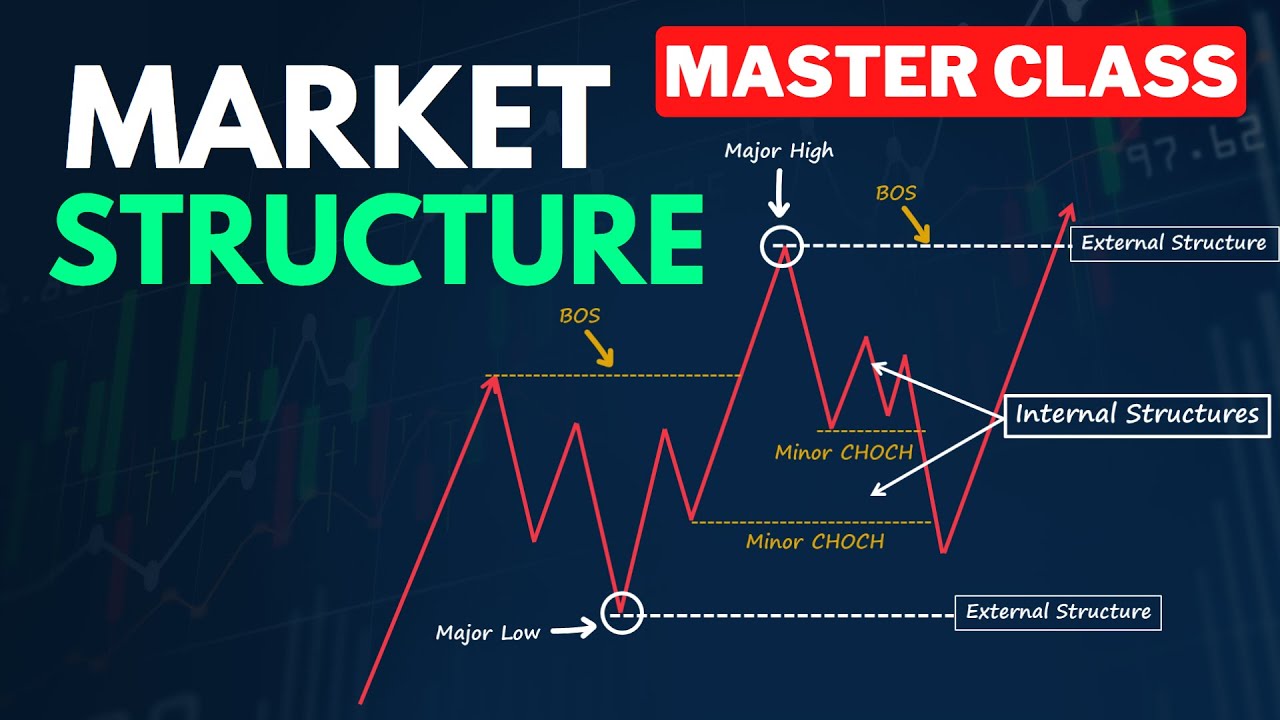
- 😀 A break of structure (BOS) occurs when price breaks past a significant high or low, signaling a potential trend change.
- 😀 A change of character (CHO) happens when the market shifts from one trend to another, and should not be confused with a break of structure.
- 😀 Common trading mistakes include trading against structure, entering weak pullbacks, confusing BOS with CHO, and ignoring higher time frames.
- 😀 Always confirm the market structure across at least two time frames (e.g., 15-minute for entry, 1-hour for confirmation).
- 😀 Be cautious of misinterpreting short-term pullbacks as trend reversals; always zoom out to assess higher time frames.
- 😀 Tools like the 'happy trail' indicator can provide more confidence in your trades once you’ve confirmed a change of character and volume increase.
Q & A
What is market structure in trading?
-Market structure refers to how price moves over time. It's essentially the roadmap of price action, showing patterns of trends and price reversals. Understanding market structure is crucial for making informed trading decisions.
What are the key components to identify when analyzing market structure?
-The key components to identify are swing highs and swing lows, the trend direction (uptrend or downtrend), Break of Structure (BOS), and Change of Character (CHO). These elements help determine the market’s current behavior.
What defines an uptrend in market structure?
-An uptrend is defined by higher highs and higher lows. Each high is higher than the previous one, and each low is higher than the previous low. This pattern shows a bullish market trend.
How do you identify a downtrend in market structure?
-A downtrend is identified by lower highs and lower lows. Each high is lower than the previous one, and each low is lower than the previous low, indicating a bearish market movement.
What is a Break of Structure (BOS)?
-A Break of Structure (BOS) occurs when price breaks through a significant high or low in the market. In an uptrend, this means breaking above a previous higher high. In a downtrend, it means breaking below a previous lower low, signaling a potential shift in market direction.
How is a Change of Character (CHO) different from a Break of Structure?
-A Change of Character (CHO) indicates a shift in market sentiment, such as a change from bearish to bullish or vice versa. It is not the same as a Break of Structure, which involves price breaking through previous highs or lows. CHO is more about the overall market mood, while BOS is about price movement beyond significant levels.
Why is it important to confirm market structure across multiple timeframes?
-Confirming market structure across multiple timeframes ensures you're not misled by short-term price movements. For example, a pullback on a 5-minute chart might seem like a trend reversal, but on a higher timeframe, it could just be a minor correction in a larger trend.
What are common mistakes traders make when analyzing market structure?
-The common mistakes include trading against the prevailing structure, entering during weak pullbacks, confusing a Change of Character with a Break of Structure, and ignoring higher timeframes when analyzing price action.
How should a trader identify a Break of Structure on a chart?
-To identify a Break of Structure, mark the lowest point of the recent swing low (for downtrends) or the highest point of the recent swing high (for uptrends) with a dotted line. Once price closes beyond that level, you can confirm the break of structure.
What role does the 'Happy Trail' indicator play in trading?
-The 'Happy Trail' indicator helps traders time their entries more confidently by confirming the direction of the trend after a Change of Character has occurred. It can be used to identify volume increases and better entry points after completing market analysis.
Outlines

This section is available to paid users only. Please upgrade to access this part.
Upgrade NowMindmap

This section is available to paid users only. Please upgrade to access this part.
Upgrade NowKeywords

This section is available to paid users only. Please upgrade to access this part.
Upgrade NowHighlights

This section is available to paid users only. Please upgrade to access this part.
Upgrade NowTranscripts

This section is available to paid users only. Please upgrade to access this part.
Upgrade NowBrowse More Related Video
Advanced Market Structure Course (Full Tutorial)

Master SMC/ ICT Market Structure The Correct Way (very easy)
ICT Advanced Market Structure | The ONLY Video You Will ever Need

Master MARKET STRUCTURE Strategy Now to MAKE MILLIONS

How To Understand Market Structure | FOREX | SMC (Part 1)

Trading Transformation Day 6: Highs, Lows, and Trends
5.0 / 5 (0 votes)