Advanced Market Structure Course (Full Tutorial)

Smart Risk
14 Oct 202314:49

Summary

TLDRThis insightful video delves into the critical aspects of market structure for traders, emphasizing the importance of identifying trends and consolidation phases. It outlines the dynamics behind market movements, distinguishing between uptrends, downtrends, and consolidation phases. The video provides a basic introduction to market structures and then explores advanced concepts, focusing on the identification of major highs and lows to detect trend reversals or continuations. It explains the significance of breaks of structure (BOS) and the rules for determining valid breaks, which are crucial for avoiding trading pitfalls. The video also highlights the concept of 'change of character' in market behavior, differentiating between minor and major changes and their implications for trading strategies. By the end, viewers are encouraged to backtest strategies and provided with a platform for doing so. The presenter stresses the need for patience and accurate market structure identification to avoid entering trades on the wrong side of the market.

Takeaways

  • 📈 **Market Structure Identification**: Understanding market structure is crucial for traders to succeed, as it helps identify trends and consolidation phases.
  • 🔄 **General Market Behavior**: Market movements are influenced by trending (uptrends and downtrends) and consolidation phases, which are essential for price direction.
  • 🔺 **Uptrend Dynamics**: In an uptrend, prices form higher highs and lows, and a break of a major low signals the end of the uptrend.
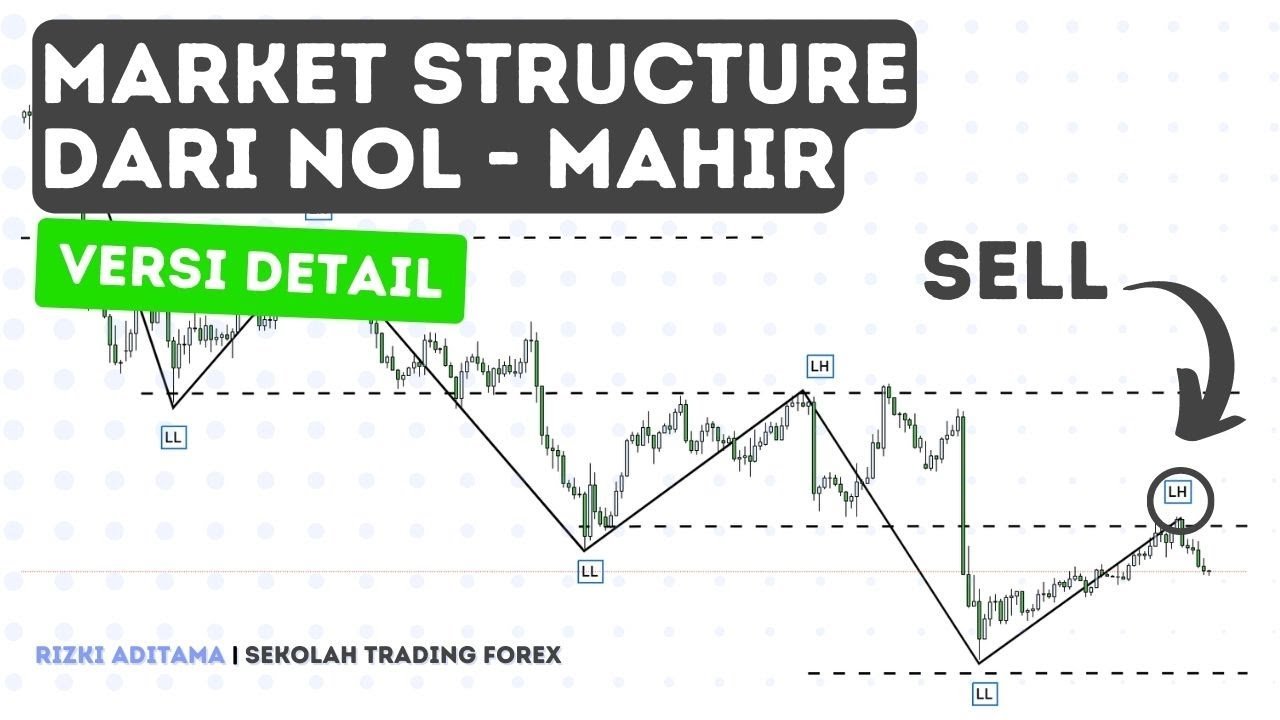
  • 🔻 **Downtrend Dynamics**: In a downtrend, prices form lower lows and highs, and a break of a major high signals the end of the downtrend.
  • 📊 **Major Highs and Lows**: Identifying valid major highs and lows is key to detecting trend reversals or continuations in the market.
  • 🛠️ **Break of Structure (BOS)**: A valid BOS occurs when the price breaks and closes above (in an uptrend) or below (in a downtrend) the most recent higher high or lower low.
  • 🚫 **Invalid BOS Scenarios**: A break with a long shadow or wick that closes within the high's range does not constitute a valid BOS.
  • 🔄 **Internal vs. External Structures**: Internal structures are price actions within the range of external structures and do not affect the market's primary direction unless a major low or high is broken.
  • ⏳ **Patience for Market Shifts**: Traders should wait for a major change of character, confirmed by the price breaking and closing beyond the last major low or high, before considering a market structure shift.
  • ⚠️ **Risk of Falling into Traps**: Not properly identifying pivotal points can lead to trading on the wrong side of the market and falling into traps.
  • 📚 **Backtesting Importance**: Before using a strategy in a live account, it should be backtested at least 100 times to ensure its validity and effectiveness.
  • 📉 **Bearish Market Structure**: The principles of market structure, BOS, and change of character apply similarly to bearish scenarios, with attention to breaking major highs and lows.

Q & A

  • What is the initial key step that every trader must take on their trading journey?

    -The initial key step for every trader is to accurately identify and understand the market structure along with its crucial elements.

  • What are the two key factors that consistently influence price direction in the market?

    -The two key factors that consistently influence price direction are trending, which includes uptrend and downtrend, and the consolidation phase, like a choppy or ranging market.

  • What is the significance of identifying valid major highs and lows in the market structure?

    -Identifying valid major highs and lows is critical as it enables traders to detect signals for a trend reversal or continuation in the market. Without proper identification, there is a risk of falling into traps and trading on the wrong side of the market.

  • What is an ideal uptrend market structure characterized by?

    -An ideal uptrend market structure is characterized by prices consistently forming higher highs and higher lows, where the price typically breaks the previous highs while holding the lows.

  • What is a break of structure (BOS) and how is it identified in a valid manner?

    -A break of structure (BOS) is a situation where the price breaks a high to the upside or a low to the downside, indicating a potential trend reversal or continuation. A valid BOS occurs when the price breaks and closes above (in an uptrend) or below (in a downtrend) the most recent higher high or lower low with the body of a candle.

  • What is considered when determining a valid change of character in the market structure?

    -To determine a valid change of character, one must first determine the general market direction, highlight the valid break of structures on the price chart, and then look for the price to break and close below the last major low (in a bullish scenario) or above the recent major high (in a bearish scenario) with the body of a candle.

  • Why is it important to wait for a major change of character before entering a short position in a bullish market?

    -It is important to wait for a major change of character because a minor change of character alone cannot be regarded as a sign of a shift in the market structure. Entering a short position prematurely may result in a stop loss being triggered as the market continues its primary direction.

  • What is the recommended practice before using a strategy or setup in a real trading account?

    -The recommended practice is to backtest the strategy or setup at least 100 times to ensure its effectiveness and reliability in real market conditions.

  • What tool is mentioned in the script for backtesting trading strategies and setups?

    -The Trader Edge platform is mentioned as a tool for backtesting trading strategies and setups.

  • What is the implication of the price breaking the recent higher high with a long shadow or wick in a bullish scenario?

    -If the price breaks the recent higher high with a long shadow or wick and the body of the candle promptly closes below the range of the high, with the subsequent candle's wick not surpassing the first candle's wick, it is not considered a valid break of structure. The low in this case is regarded as an internal structure within the trading range.

  • How does the consolidation phase in the market contribute to the accumulation of liquidity and institutional orders?

    -The consolidation phase is a period where price typically does not move in a clear uptrend or downtrend, creating a range or choppy market conditions. During this phase, liquidity accumulates as traders and investors wait for clearer direction, and institutional orders may also be placed in anticipation of the next major market move.

  • What is the role of internal structures in defining the current area of interest and trading range in the market?

    -Internal structures are the price movements that occur between the major external structures (major highs and lows). They define the current area of interest and trading range as long as the price remains within the bounds of the most recent major low (in a bullish state) or major high (in a bearish state), indicating the ongoing market trend.

Outlines

00:00

📈 Understanding Market Structure for Successful Trading

The first paragraph emphasizes the importance of identifying and mapping market structure for traders to achieve success and profitability. It outlines the reasons why traders might face losses, such as failing to understand market dynamics. The video promises to cover both basic and advanced concepts of market structure, providing keys and tips for mapping it. It introduces the general behavior behind market movements, focusing on trending and consolidation phases. The concept of uptrends and downtrends is explained, where in an uptrend, prices form higher highs and lows, and in a downtrend, they form lower lows and highs. The paragraph also discusses the importance of identifying valid major highs and lows to detect trend reversal or continuation signals.

05:00

📉 Validating Break of Structure (BOS) and Market Dynamics

The second paragraph delves into the specifics of identifying valid major highs and lows in the market structure. It explains the process of recognizing a realistic uptrend structure and the significance of internal and external structures. The paragraph clarifies the conditions under which a break of structure (BOS) is considered valid, such as when the price breaks and closes above the most recent higher high with the body of a candle. It also addresses scenarios where a BOS is not valid and the importance of waiting for a major low or high break to signal a trend reversal. The concept of backtesting trading strategies is introduced, with a recommendation to use the Trader Edge platform for this purpose.

10:00

🔄 Market Structure Shifts and Change of Character

The third paragraph discusses the concept of a change of character in market structure, which is crucial for identifying valid trend shifts. It differentiates between minor and major changes of character, noting that a minor change alone is not indicative of a market structure shift. The paragraph warns against the common mistake of novice traders who misinterpret minor changes as signals for market reversal. It stresses the importance of waiting for a major change of character, which is confirmed when the price breaks and closes below the last major low in a bullish scenario or above the recent major high in a bearish scenario. The video concludes by encouraging viewers to subscribe and provide feedback for future content.

Mindmap

Keywords

💡Market Structure

Market Structure refers to the pattern of price movements in the financial markets, which can be categorized into trends and consolidation phases. It is essential for traders to understand and map this structure to identify opportunities and manage risk effectively. In the video, the concept is explored in detail to help traders distinguish between uptrends, downtrends, and consolidation phases, which are crucial for making informed trading decisions.

💡Trend

A trend in trading denotes the general direction in which prices are moving. It can be either an uptrend, where prices are consistently making higher highs and higher lows, or a downtrend, characterized by lower highs and lower lows. The video emphasizes the importance of identifying the trend to predict future price movements and to trade in the direction of the prevailing trend.

💡Consolidation Phase

The consolidation phase is a period during which an asset's price remains relatively stable and ranges within a certain price level. It is often seen as a time when the market accumulates liquidity and institutional orders before the next significant price movement. In the context of the video, consolidation is portrayed as an essential part of the market cycle, alternating with trending phases.

💡Break of Structure (BOS)

A Break of Structure (BOS) occurs when the price of an asset moves beyond a previously established high or low, indicating a potential shift in the market trend. The video outlines specific criteria for a valid BOS, such as the price breaking and closing above the most recent higher high with the body of a candle, which signifies a continuation or reversal of the trend.

💡Major Highs and Lows

Major highs and lows are pivotal points in the market structure that represent significant resistance or support levels. They are crucial for identifying trend reversals or continuations. The video explains how to identify valid major highs and lows, which are used to define the external structures that bound the current area of interest and trading range.

💡Internal Structures

Internal structures are price movements that occur within the range of major highs and lows, which are the external structures. The video discusses how internal structures are not as significant as external ones unless they lead to a break of the major low or high, which could indicate a trend reversal or continuation.

💡Change of Character

Change of character in the context of market structure refers to a significant shift in the nature of the market's movement, such as transitioning from a trending phase to a consolidation phase or vice versa. The video explains that a valid change of character requires the price to break and close beyond the last major low or high, which confirms a shift in the market structure.

💡Backtesting

Backtesting is the process of testing a trading strategy using historical market data to see how it would have performed in the past. The video recommends backtesting a strategy at least 100 times before using it in a live trading environment. Backtesting helps traders to refine their strategies and understand their potential performance and risk.

💡Trader Edge Platform

The Trader Edge Platform is mentioned in the video as a tool for backtesting trading strategies and setups. It is presented as a resource that traders can use to validate their strategies by simulating them against past market conditions, which is a critical step in ensuring the robustness of a trading approach.

💡Stop Loss

A stop loss is an order placed by a trader to limit their potential loss on a trade. In the context of the video, it is discussed how improperly identifying market structure can lead traders to place stop losses that get triggered by retracements rather than true trend reversals. The video advises traders to set stop losses carefully, considering the major lows or highs of the market structure.

💡Liquidity

Liquidity in financial markets refers to the ease with which an asset can be bought or sold without affecting its price. The video mentions that during consolidation phases, the market accumulates liquidity, which is important for institutional orders and can precede significant price movements.

Highlights

Understanding market structure is crucial for traders to achieve success and profitability in their trading journey.

Market movements can be categorized into trending (uptrend and downtrend) and consolidation phases.

An uptrend is characterized by higher highs and higher lows, while a downtrend shows lower lows and lower highs.

Identifying valid major highs and lows is essential for detecting trend reversal or continuation signals.

The consolidation phase is a period where price action is choppy or ranging, accumulating liquidity and institutional orders.

A realistic market structure involves internal structures formed between major external structures.

A break of structure (BOS) occurs when the price breaks and closes above the most recent higher high or below the most recent lower low.

A valid BOS is identified by specific rules, such as the candle's body closing above the high or below the low.

A long shadow or wick on a candle does not constitute a valid break of structure if it closes within the high's range.

A change of character in the market is indicated by a major change in the price action, such as breaking the last major low in a bullish scenario.

Traders often face losses due to misinterpreting minor changes of character as market structure shifts.

Backtesting trading strategies is recommended to ensure their effectiveness before using them in a live trading account.

The Trader Edge platform is used for backtesting exclusive trading strategies and setups.

A valid change of character requires the price to break and close with the body of a candle, not just a wick or shadow penetration.

In a bearish market structure, a valid break of structure is identified by the price breaking and closing below the most recent lower low.

Internal price action within the range of external structures is irrelevant as long as the price remains within the defined trading range.

The video emphasizes the importance of patience and correct identification of market structures to avoid entering trades on the wrong side of the market.

For a comprehensive understanding, traders are encouraged to watch the entire video, take notes, and subscribe to the channel for updates.

Transcripts

play00:00

hello Traders and welcome back to

play00:01

another episode of smart

play00:03

risk accurately identifying and mapping

play00:06

the market structure along with its

play00:08

crucial elements is the initial key step

play00:10

that every Trader must take on their

play00:12

trading Journey for success and

play00:14

profitability one of the primary reasons

play00:17

many Traders face losses is their

play00:18

failure to properly identify and

play00:21

understand the market structure in this

play00:23

episode we explained both Advanced and

play00:25

basic concepts of Market structure that

play00:27

are essential for every Trader to

play00:29

understand and apply in their trading

play00:31

Journey additionally we will unveil the

play00:33

keys and tips for Market structure

play00:35

mapping propelling you one step ahead in

play00:37

the market be sure to watch the entire

play00:40

video slowly until the end and take

play00:42

notes for a better and more

play00:43

comprehensive understanding so Traders

play00:46

if that's something you're interested in

play00:48

please give this video a thumbs up to

play00:49

show your support and subscribe to our

play00:51

Channel if you are new see you after

play00:52

intro

play00:55

[Music]

play01:01

[Music]

play01:03

welcome back Traders so let's get

play01:05

started with the market structure

play01:06

General Behavior the Dynamics behind

play01:09

Market movements can be boiled down to

play01:11

two key factors that consistently

play01:13

influence price Direction trending which

play01:16

includes uptrend and downtrend and the

play01:18

second factor is the consolidation phase

play01:20

like a choppy or ranging Market imagine

play01:23

it like a continuous Circle where price

play01:25

always moves between downtrends uptrends

play01:28

and also consolidations that accumulate

play01:30

liquidity and institutional orders price

play01:33

usually needs to consolidate between

play01:34

uptrends and downtrends and vice versa

play01:37

the first question to consider when

play01:39

opening charts on your screen is whether

play01:41

the market is in an uptrend downtrend or

play01:43

consolidating phase to gain a solid

play01:46

understanding let's begin with a basic

play01:48

introduction to Market structures and

play01:50

then delve into the key points of

play01:51

advanced Market

play01:53

structures consider a market structure

play01:56

that represents an ideal uptrend I refer

play01:59

to this type of Market structure as

play02:01

ideal because it is rare to find an

play02:04

uptrend in the market that exactly

play02:06

mirrors this pattern prices typically do

play02:09

not behave with such Simplicity

play02:11

nonetheless for a clearer understanding

play02:13

of an uptrend let's briefly take a look

play02:15

at this ideal structure before moving on

play02:17

to a more realistic uptrend structure

play02:19

that frequently emerges in the market in

play02:22

an uptrend prices consistently form

play02:24

higher highs and higher lows the price

play02:26

typically breaks the previous highs

play02:28

while holding the lows an uptrend ends

play02:31

when the price breaks one of the major

play02:32

lows to the downside for example to

play02:34

maintain the uptrend it's crucial that

play02:37

price does not break this major low

play02:39

whenever the price breaks a major High

play02:41

to the upside it forms a break of

play02:43

structure and establishes a demand Zone

play02:45

associated with the BOS

play02:47

wave identifying valid major highs and

play02:50

lows is critical as it enables us to

play02:52

detect signals for a trend reversal or

play02:54

continuation in the market without

play02:56

proper identification of these pivotal

play02:58

points there is a risk of falling into

play03:00

traps and trading on the wrong side of

play03:02

the market the same Concepts apply to

play03:04

the bearish

play03:07

scenario in a downtrend prices

play03:09

consistently create a series of lower

play03:11

lows and lower highs in this scenario

play03:14

the price has a tendency to break the

play03:16

previous lows while maintaining the

play03:19

highs now let's delve into the details

play03:21

of the realistic Market

play03:24

structure this represents the realistic

play03:27

uptrend structure that is more commonly

play03:29

observed in the market market now let's

play03:31

consider a scenario where the price

play03:33

breaks the previous highs to the upside

play03:35

at this point a crucial question arises

play03:38

how do we identify valid major highs and

play03:41

lows to address this if we look at the

play03:44

left side of the structure it is clear

play03:46

that price experienced an upward

play03:48

movement until it started to retrace the

play03:51

highest point reached by the price

play03:52

before the retracement movement began is

play03:54

considered the major High additionally

play03:57

the lowest point of the bullish wave

play03:59

that in initiated the upward movement

play04:01

leading to the formation of a break of

play04:03

structure and a new high is recognized

play04:06

as the major

play04:07

low these two points constitute the

play04:09

major external structures and every

play04:11

structure formed between them is

play04:13

regarded as an internal

play04:14

structure if the price breaks the major

play04:17

High to the upside creating a break of

play04:19

structure BOS it signals a continuation

play04:23

of the

play04:23

trend however if the price Falls below

play04:26

the major low we should consider it as a

play04:28

trend reversal signal signal the

play04:31

specific internal price action within

play04:33

the range of external structures doesn't

play04:35

matter as long as the price remains

play04:37

above the most recent major low as long

play04:39

as this condition is met we consider the

play04:42

market to be in a bullish State now that

play04:44

we've identified the recent major

play04:46

external structures these structures

play04:48

Define the current area of interest and

play04:50

the current trading range as we see the

play04:53

price has entered the retracement phase

play04:56

generating a series of internal

play04:57

structures particularly bearish

play05:00

ones subsequently after forming a

play05:02

bullish internal realignment the price

play05:05

breaks the recent major High to the

play05:06

upside establishing a fresh major high

play05:09

and low the newly generated major low is

play05:12

this internal low situated at the

play05:14

extreme this low is considered major

play05:17

because it is the last low created

play05:19

before the price initiated an upward

play05:21

movement leading to the break of

play05:23

structure you might be wondering why we

play05:25

don't regard this low structure as the

play05:27

major low the rationale behind this is

play05:30

that the low located at the extreme is

play05:32

the ultimate and lowest point before the

play05:34

price initiates an upward movement this

play05:37

particular low is crucial as it is the

play05:39

key low that triggered the upward

play05:41

movement and subsequently the break of

play05:44

structure moving on to the bearish

play05:46

scenario which is simply just the same

play05:48

as the bullish scenario initiating the

play05:50

bearish wave leading to a break of

play05:52

structure additionally we have a major

play05:55

low marking the lowest point the price

play05:57

reached after the break of structure

play05:59

these two structures the major high and

play06:02

low constitute our external structures

play06:05

while everything formed between them is

play06:07

considered internal

play06:08

structures if the price breaks the major

play06:11

lows to the downside creating a break of

play06:13

structure it signals a continuation

play06:15

Trend like what we see here however if

play06:18

the price rises above the major High we

play06:20

should consider it as a trend reversal

play06:22

signal in simpler terms the nature of

play06:25

internal price action within the

play06:27

external structures doesn't matter as

play06:29

long as as the price remains below the

play06:31

most recent major High indicating a

play06:33

bearish market as the price retraced

play06:36

upward it formed a series of internal

play06:38

highs and lows within our trading range

play06:40

however it eventually went back down and

play06:43

broke the recent major low to the

play06:45

downside this internal High located at

play06:47

the extreme becomes our newly generated

play06:50

major high this is because it represents

play06:52

the highest internal High created before

play06:54

the price initiated a strong bearish

play06:56

push resulting in a new break of

play06:58

structure following this the price

play07:00

retraced once more forming another major

play07:03

low subsequently after creating various

play07:06

internal structures the price continued

play07:08

its downward momentum establishing a

play07:10

sequence of lower lows and lower

play07:13

highs now we will delve into another

play07:15

crucial aspect of Market structure the

play07:18

break of structure

play07:20

BOS you've likely encountered BOS in

play07:23

various trading tutorials Market

play07:25

structure videos and trading handbooks

play07:28

for example in a bullet structure is

play07:30

often defined simply as a situation

play07:32

where the price breaks a high to the

play07:34

upside however in reality there are

play07:36

specific rules and key points that we

play07:38

must consider to identify a valid break

play07:40

of structure now let's move on to the

play07:43

specifics of those key points and

play07:45

rules a valid break of structure occurs

play07:48

when the price breaks and closes above

play07:50

the most recent higher high with the

play07:52

body of a candle this holds true even if

play07:55

the price immediately moves downward

play07:57

after breaking the structure in this

play07:59

scenario the price generates a new major

play08:02

low and major High and establishes a new

play08:05

trading range if the price subsequently

play08:07

breaks this newly regenerated major low

play08:09

to the downside it indicates a potential

play08:12

Trend reversal this shift signals that

play08:15

the price is no longer bullish marking a

play08:17

change of

play08:19

character however if price breaks the

play08:21

recent higher high with a long Shadow or

play08:24

Wick and the body of the candle promptly

play08:26

closes below the range of the high with

play08:28

the subsequent candle's Wick not

play08:30

surpassing the first candle's Wick we do

play08:33

not consider this scenario a valid break

play08:35

of

play08:35

structure in this case we regard this

play08:38

low as an internal structure formed

play08:40

inside our trading range to identify a

play08:43

trend reversal signal or a valid change

play08:45

of character we should wait for the

play08:47

price to break the major low located at

play08:48

the extreme rather than Breaking the

play08:50

upper internal

play08:52

high now consider another scenario if

play08:55

the price breaks the recent higher high

play08:57

with a wick and then the body body of

play08:59

the first candle closes below the range

play09:01

of the high with the subsequent candle's

play09:03

Wick exceeding the first candle's Wick

play09:06

we can consider it a valid bullish break

play09:08

of structure in this case we have a

play09:11

newly formed major High and a major low

play09:13

defining our updated trading range the

play09:16

nature of internal price action within

play09:18

the range of this high and low doesn't

play09:19

matter as long as the price remains

play09:21

above our newly generated major low

play09:24

indicating a bullish Market only if the

play09:26

price breaks the newly formed low to the

play09:28

downside we can consider it a valid

play09:31

Trend reversal signal or a valid change

play09:33

of character pattern now let's briefly

play09:36

break down the bearish scenario which is

play09:38

essentially the same as the bullish one

play09:41

before using a strategy or setup in a

play09:43

real account it's recommended to back

play09:45

test it at least 100 times to help you

play09:48

with this critical step we use the

play09:50

trader Edge platform for back testing

play09:52

our exclusive trading strategies and

play09:54

setups if you're interested in using

play09:56

Trader Edge as your back testing tool be

play09:58

sure to check out the link in the

play10:00

description

play10:01

below consider a bearish market

play10:04

structure to have a valid break of

play10:06

structure we require the price to break

play10:08

and close below the most recent lower

play10:10

low with the body of a candle therefore

play10:14

if the price breaks the newly generated

play10:16

major High to the upside we consider it

play10:18

as a trend reversal signal indicating

play10:21

that sellers have lost

play10:23

control conversely if the price breaks

play10:26

the recent lower low with a long Shadow

play10:28

or a wick and the body of the candle

play10:30

promptly closes above its range with the

play10:33

subsequent candle's Shadow not

play10:34

surpassing the first candle's Wick we

play10:37

should not regard it as a valid break of

play10:39

structure to establish a genuine bearish

play10:41

break of structure we should wait for

play10:43

the price to close below the lows range

play10:46

with the body of a

play10:48

candle on the other hand if the

play10:50

subsequent candle's Wick exceeds the

play10:52

first candle's Wick and closes above the

play10:54

low's range then we have a valid break

play10:57

of structure additionally we need to

play11:00

update our major low and major high as

play11:02

long as the price remains below our

play11:04

newly generated major High we consider

play11:06

the Market's direction is bearish only

play11:09

if the price breaks the newly formed

play11:11

High to the upside we are allowed to

play11:12

consider it a valid Trend reversal

play11:14

signal or a major change of character

play11:16

having explored various types and

play11:18

scenarios of break of structure patterns

play11:20

and now possessing a solid understanding

play11:22

of a valid BOS let's delve into another

play11:25

key factor of Market structure mapping

play11:27

change of character to identify a valid

play11:30

change of character the first step

play11:31

involves determining the General market

play11:33

Direction whether it's in an uptrend or

play11:36

downtrend subsequently you must

play11:38

highlight the valid break of structures

play11:40

on your price

play11:44

chart in the bullish scenario imagine

play11:47

the price creating a series of valid

play11:49

break of structures this low and high

play11:52

represent our major structures

play11:53

associated with the first valid bullish

play11:56

BOS as previously mentioned any price

play11:59

action C forming between these two

play12:00

structures is considered

play12:02

internal change of character patterns

play12:04

can be categorized into two types minor

play12:07

and major for example each time the

play12:09

price breaks any internal low it

play12:12

signifies a minor change of character

play12:14

it's important to note that a minor

play12:16

change of character alone cannot be

play12:18

regarded as a sign of a shift in the

play12:20

market

play12:21

structure here we facing a common

play12:23

scenario that frequently occurs in the

play12:25

market many novice traders who haven't

play12:28

correctly identified the market

play12:29

structure often consider this minor

play12:31

change of character a signal of a

play12:33

reversal in Market Direction They

play12:36

believe that the bullish phase has ended

play12:37

and it's an ideal time to go

play12:39

short they typically Place their stop

play12:42

loss just above this internal High

play12:45

however contrary to their expectations

play12:47

price after making a brief retracement

play12:49

went back up and continued its bullish

play12:51

movement this resulted in hitting the

play12:53

stop loss of traders who had taken short

play12:56

positions they often failed to realize

play12:58

why their stop loss was triggered by the

play12:59

price and unfortunately they repeat

play13:02

these actions

play13:03

repeatedly what they missed here is a

play13:06

crucial point the price didn't break

play13:08

this major low over here to confirm a

play13:10

market structure shift they shouldn't

play13:13

have entered a short position until the

play13:14

price broke the last major low to the

play13:17

downside their identified change of

play13:19

character was invalid and the price only

play13:21

was in its retracement phase before

play13:23

continuing to its primary direction to

play13:26

obtain a valid Market structure shift

play13:28

signal one one should patiently wait for

play13:30

the price to establish a major change of

play13:32

character by breaking and closing below

play13:34

the last major low that initiated the

play13:37

upward movement leading to the bullish

play13:39

break of

play13:41

structure furthermore it's crucial to

play13:44

always remember that in a bullish

play13:45

scenario a change of character pattern

play13:48

is considered valid only when the price

play13:50

breaks and closes below the last major

play13:52

low with the body of a

play13:55

candle if the price breaks the most

play13:58

recent structure with a long Wick or

play13:59

Shadow and closes within the high's

play14:01

range then the change of character is

play14:04

invalid and we cannot consider it a

play14:06

market structure

play14:07

shift the same concept applies to the

play14:10

bearish scenario for a valid change of

play14:13

character that provides a high

play14:14

probability we need the price to break

play14:16

and close above the recent major high

play14:18

with the body of a candle a penetration

play14:21

with a shadow or Wick is not

play14:24

acceptable that's it Traders thank you

play14:26

for watching this video I hope you found

play14:28

it in formative and useful don't forget

play14:31

to hit the Subscribe button and turn on

play14:32

notifications to stay updated on our

play14:34

latest videos we value your feedback and

play14:37

suggestions so please leave your

play14:39

comments below and let us know what

play14:41

topics you'd like us to cover in our

play14:42

future videos we appreciate your support

play14:45

and look forward to seeing you in the

play14:47

next episode

Rate This

5.0 / 5 (0 votes)

Related Tags
Market StructureTrading StrategiesTrend AnalysisPrice ActionTechnical AnalysisRisk ManagementTrading JourneyFinancial MarketsEducational ContentInvestment Tips