NVDA Stock - Has NVIDIA Topped?
Summary
TLDRIn this Nvidia stock analysis video, the host examines the stock's recent performance, discussing its current downward movement and potential for further retracement. The analysis highlights key technical indicators such as trend lines, moving averages, and candlestick patterns like the bearish piercing candle. The host suggests that while Nvidia may experience short-term downside, it's still fundamentally bullish in the long run, with targets around $130 to $120. Additionally, options flow and buyer exhaustion are noted as concerns. Despite short-term risks, the host remains optimistic about Nvidia's future potential for recovery and growth.
Takeaways
- 😀 The video discusses Nvidia's stock performance, including the potential for a short-term downturn and the hope for bullish momentum to continue.
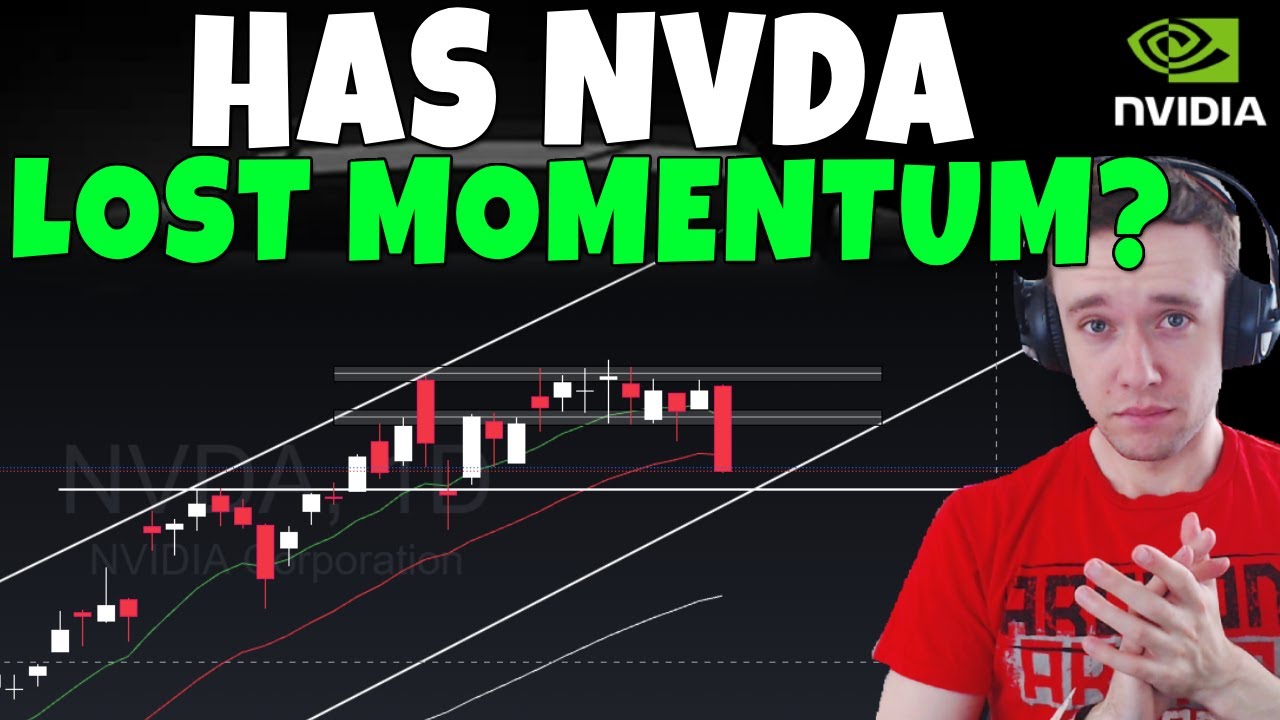
- 😀 The stock closed down 8% on the day, just shy of $143, prompting concerns about whether it is topping out or still has room for growth.
- 😀 The key observation is that the stock closed below a trendline, a significant signal for potential retracement, but there are still other factors to monitor.
- 😀 Despite the trendline loss, the 8 Exponential Moving Average (EMA) is still holding, providing support for the bulls in the short term.
- 😀 The 142 price level is important for monitoring; if Nvidia starts closing below this, it would signal more downside risk.
- 😀 The stock printed a bearish piercing candlestick pattern, which could signal a potential downward move, though it is not guaranteed.
- 😀 If Nvidia's price closes below today's low of $142, this would further confirm the bearish trend, with potential for a drop to the 130s.
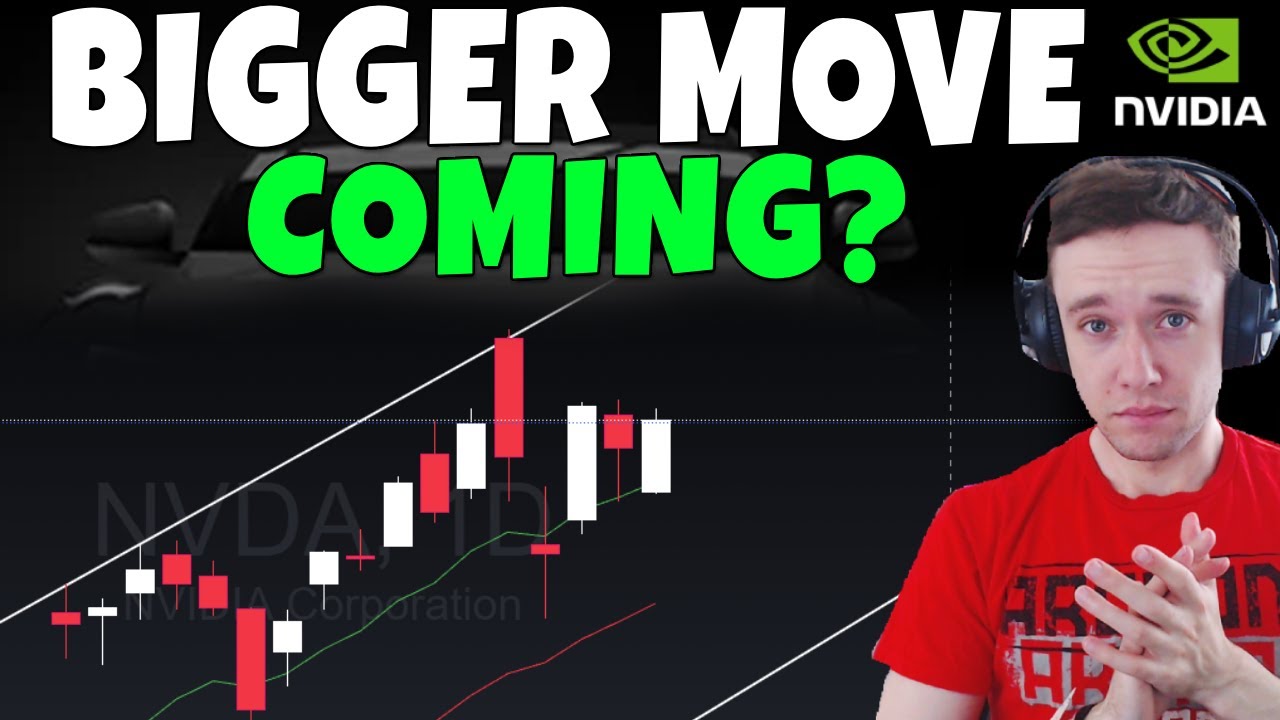
- 😀 The weekly chart still shows bullish signs, with the stock above its key moving averages and the stochastic indicator in the green zone, suggesting longer-term strength despite short-term volatility.
- 😀 A potential downside target for Nvidia is around $130, with a more bearish target at $120, but these levels would still be considered bullish in the grand scheme.
- 😀 The video emphasizes that any downside movement should be viewed as a potential buying opportunity, as the stock's long-term outlook remains positive.
- 😀 Options flow data shows that there are some concerns about Nvidia's future price action, with notable bearish signals, but the overall momentum is still slightly bullish.
Q & A
What is the main topic of the video?
-The main topic of the video is an analysis of Nvidia's stock performance, discussing whether it is topping out or if there is still hope for the bulls.
What was the stock's performance on the day of the video?
-Nvidia's stock closed the day down by 8%, at just shy of $143.
What technical indicator does the speaker mention in relation to Nvidia's stock trend?
-The speaker mentions the trend line and the 8 exponential moving average (EMA) as important technical indicators for Nvidia's stock movement.
What does the speaker say about the trend line?
-The speaker points out that Nvidia's stock has closed below the trend line, which they believe could indicate that upward momentum is stalling.
What other levels does the speaker suggest to watch for potential concerns?
-The speaker suggests watching the $142 level as a potential concern. If the stock starts closing 1-hour candles below this price, it would be another red flag.
What pattern did Nvidia's stock form on the daily chart?
-Nvidia's stock formed a bearish piercing candlestick pattern, which the speaker considers a strong signal for a potential bearish reversal.
How does the speaker view the stock's potential future performance?
-The speaker remains bullish on Nvidia in the long term, even if the stock experiences short-term retracements. They suggest a downside move to around $130 or even $120 could present a buying opportunity.
What is the speaker's perspective on the weekly chart?
-The speaker views the weekly chart as very bullish, with the stochastic indicator in the green zone and Nvidia trading above all the exponential moving averages.
What is the significance of the PPI data mentioned in the video?
-The speaker mentions that the upcoming Producer Price Index (PPI) data, which is scheduled for release the day after the video, could impact Nvidia's stock performance and needs to be monitored.
What is the speaker's outlook on the options flow for Nvidia?
-The speaker notes that the options flow for Nvidia has been lackluster, with a particular mention of 2.2 million calls at a $150 strike for June 20th, but they are unsure about the accuracy of the data.
Outlines

This section is available to paid users only. Please upgrade to access this part.
Upgrade NowMindmap

This section is available to paid users only. Please upgrade to access this part.
Upgrade NowKeywords

This section is available to paid users only. Please upgrade to access this part.
Upgrade NowHighlights

This section is available to paid users only. Please upgrade to access this part.
Upgrade NowTranscripts

This section is available to paid users only. Please upgrade to access this part.
Upgrade Now


5.0 / 5 (0 votes)