STATISTIKA Part 2- Jangkauan, Kuartil dan Jangkauan interkuartil
Summary
TLDRIn this educational video, the teacher explains key statistical concepts, focusing on range, quartiles, and interquartile range. The video covers how to calculate the range for both individual data and grouped data, the process of finding quartiles (Q1, Q2, and Q3) for both types of data, and the method to calculate the interquartile range (IQR). The explanation includes step-by-step instructions, formulas, and examples for data sets with both odd and even numbers. By the end of the lesson, viewers should be able to calculate the range, quartiles, and IQR for both individual and grouped data, setting the foundation for future statistical topics.
Takeaways
- 😀 Jangkauan (Range) is the difference between the largest and smallest values in a data set, helping to measure data spread.
- 😀 Quartiles divide a data set into four equal parts: Q1 (lower quartile), Q2 (median), and Q3 (upper quartile).
- 😀 The Interquartile Range (IQR) is the difference between Q3 and Q1, representing the spread of the middle 50% of data.
- 😀 For individual data, the range is calculated by subtracting the smallest value from the largest value.
- 😀 When dealing with grouped data, the range is found by subtracting the midpoint of the lowest class from the midpoint of the highest class.
- 😀 Quartiles for individual data are calculated by finding the data points that divide the data into four equal parts.
- 😀 For grouped data, quartiles are calculated by using cumulative frequencies and identifying the class intervals where the quartiles lie.
- 😀 To calculate the position of quartiles (Q1, Q2, Q3) in grouped data, use the formula based on cumulative frequencies and total data size.
- 😀 The steps for finding quartiles in grouped data include determining the cumulative frequency, calculating class midpoints, and applying the quartile formula.
- 😀 The interquartile range (IQR) can be easily found by subtracting Q1 from Q3 once the quartiles are calculated, giving insight into data variability.
Q & A
What is the main focus of the video?
-The video focuses on teaching how to calculate the range, quartiles, and interquartile range in statistics, particularly for both single and grouped data.
What is range in statistics?
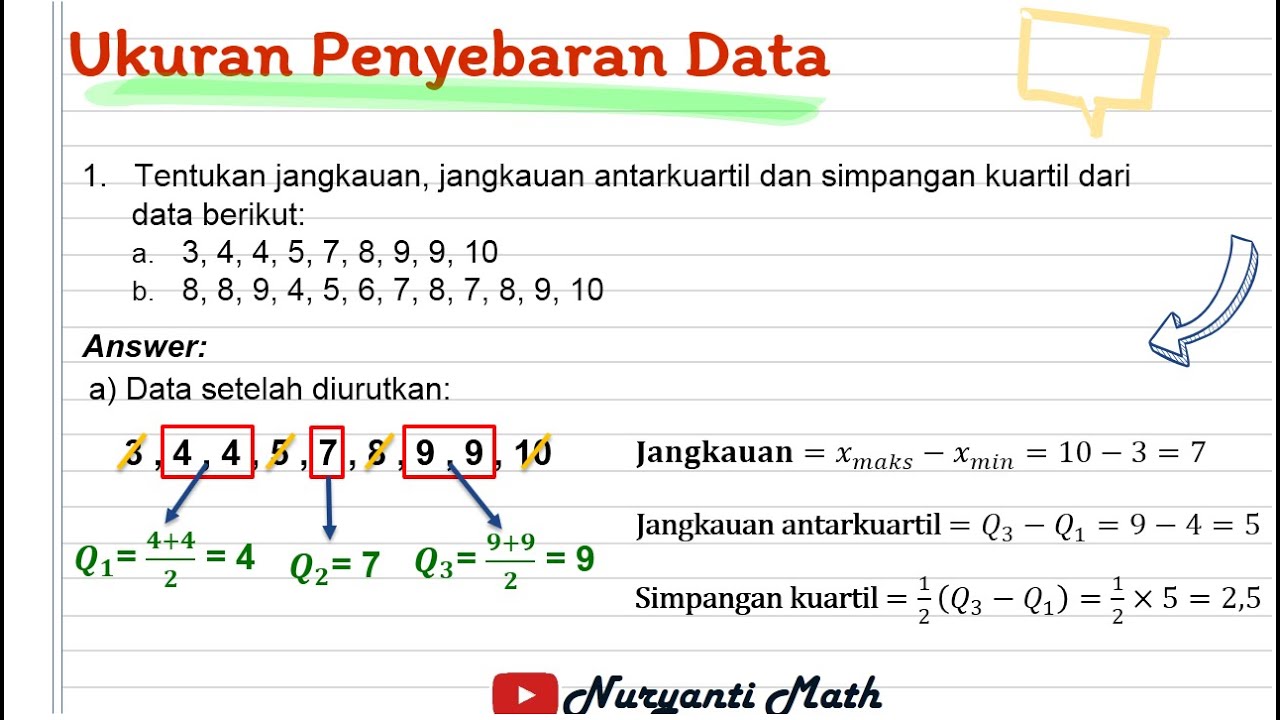
-The range is the difference between the highest and lowest values in a data set. For single data, it is calculated by subtracting the smallest value from the largest value.
How do you calculate the range for a single data set?
-To calculate the range for a single data set, subtract the smallest value from the largest value.
What is the formula for calculating the interquartile range (IQR)?
-The interquartile range is calculated by subtracting the first quartile (Q1) from the third quartile (Q3).
What are quartiles?
-Quartiles are values that divide a data set into four equal parts. The first quartile (Q1) is the median of the lower half of the data, the second quartile (Q2) is the median of the data, and the third quartile (Q3) is the median of the upper half.
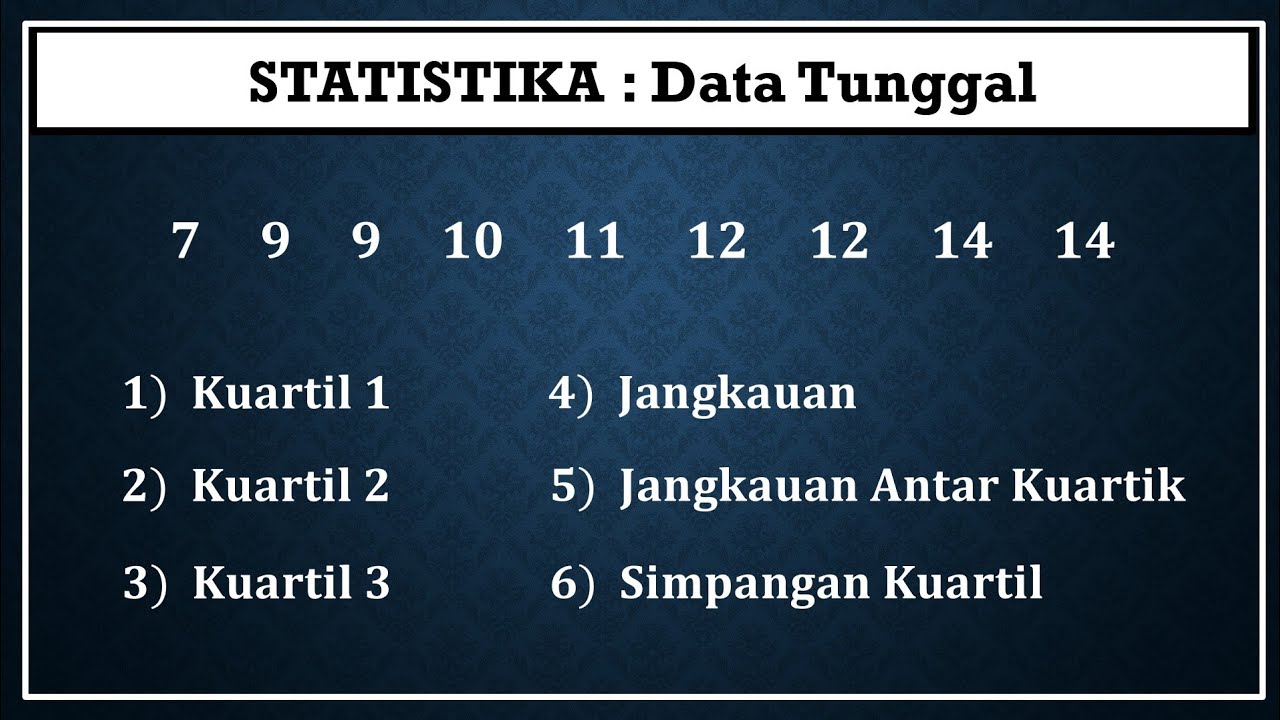
How do you find the quartiles for a data set?
-To find the quartiles for a data set, first sort the data. For an odd number of data points, the median (Q2) is the middle value, while Q1 and Q3 are the medians of the lower and upper halves, respectively. For an even number of data points, the median is the average of the two middle values.
What is the difference between data with an odd number of values and even number of values when calculating quartiles?
-When there is an odd number of data points, Q2 is the middle value. However, for an even number of data points, Q2 is the average of the two middle values, and the calculation of Q1 and Q3 follows a different method, dividing the data into smaller subgroups.
What is the method for calculating the quartiles for grouped data?
-For grouped data, first calculate the cumulative frequency, then use the class intervals and the cumulative frequency to determine the position of the quartiles, applying the formula based on the total number of data points.
What is the significance of cumulative frequency in calculating quartiles for grouped data?
-Cumulative frequency helps determine the position of each quartile in the grouped data. It is used to locate the class intervals where Q1, Q2, and Q3 fall, which are then used to calculate the actual quartile values.
How do you interpret the interquartile range (IQR)?
-The interquartile range (IQR) represents the spread of the middle 50% of a data set. A larger IQR indicates more spread out values, while a smaller IQR shows that most of the data is concentrated around the median.
Outlines

This section is available to paid users only. Please upgrade to access this part.
Upgrade NowMindmap

This section is available to paid users only. Please upgrade to access this part.
Upgrade NowKeywords

This section is available to paid users only. Please upgrade to access this part.
Upgrade NowHighlights

This section is available to paid users only. Please upgrade to access this part.
Upgrade NowTranscripts

This section is available to paid users only. Please upgrade to access this part.
Upgrade NowBrowse More Related Video

Statistika 2 ~ Ukuran Penyebaran Data (Jangkauan, Kuartil, Hamparan) ~ Materi PJJ Kelas VIII / 8 SMP
Statistika Kelas 8 [Part 4] - Menentukan Jangkauan, Kuartil, dan Jangkauan Interkuartil

Ukuran Penyebaran Data | Statistika Kelas 8

Perbedaan Jangkauan, Jangkauan Interkuartil dan Kuartil pada Statistika
Ukuran Penyebaran Data (Jangkauan, Jangkauan Antarkuartil, Simpangan Kuartil) - STATISTIKA Kelas 8
STATISTIKA - Kuartil, Jangkauan, Jangkauan Antar Kuartil Dan Simpangan Kuartil Data Tunggal
5.0 / 5 (0 votes)