Perbedaan Jangkauan, Jangkauan Interkuartil dan Kuartil pada Statistika
Summary
TLDRThis educational video explains key statistical concepts such as range, quartiles, and interquartile range (IQR). The host provides a step-by-step explanation of how to calculate the range by subtracting the smallest value from the largest, and how to find quartiles (Q1, Q2, Q3) in a sorted dataset. Additionally, the video covers the calculation of the interquartile range (IQR) by subtracting Q1 from Q3. Practical examples are given to ensure clarity, with a focus on helping viewers understand the methods for dividing data into meaningful segments. The video concludes with a polite invitation for questions and engagement in the comments.
Takeaways
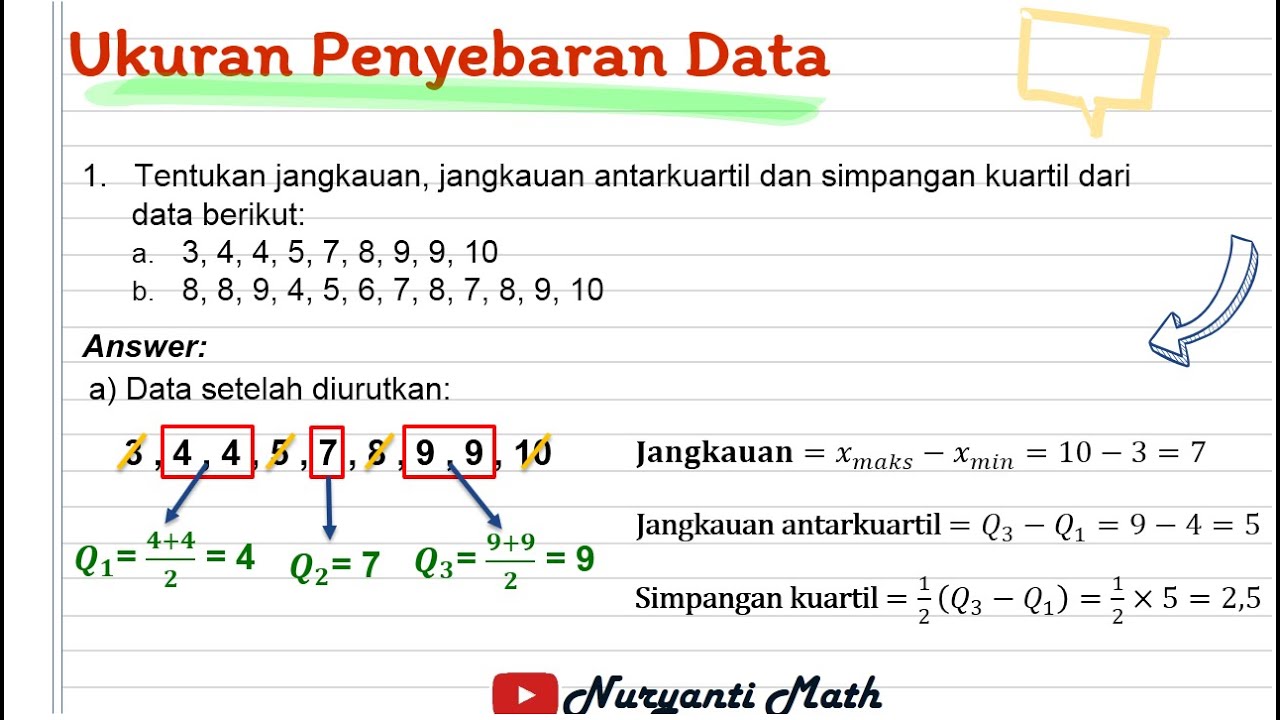
- 😀 The range is the difference between the largest and smallest values in a data set.
- 😀 To calculate the range, subtract the smallest data point from the largest.
- 😀 Quartiles divide the ordered data into four equal parts, and there are three quartiles: Q1, Q2 (median), and Q3.
- 😀 Q1 is the value that separates the first 25% of the data.
- 😀 Q2, also known as the median, divides the data into two equal halves.
- 😀 Q3 represents the value that separates the top 25% of the data.
- 😀 To find quartiles, ensure the data is ordered from smallest to largest.
- 😀 In an example with 19 data points, Q1 is found at the 5th data point, Q2 at the 10th, and Q3 at the 15th.
- 😀 The interquartile range (IQR) is the difference between Q3 and Q1, showing the spread of the middle 50% of the data.
- 😀 The IQR provides insight into data variability and is less affected by outliers compared to the range.
- 😀 The video encourages viewers to ask questions in the comments section in a polite manner.
Q & A
What is the range in statistics?
-The range in statistics is the difference between the largest and smallest values in a data set. It is calculated by subtracting the smallest value from the largest value.
How do you calculate the range from the given data?
-To calculate the range, first identify the largest and smallest values in the data set. Then subtract the smallest value from the largest value.
What is the interquartile range?
-The interquartile range (IQR) is the difference between the third quartile (Q3) and the first quartile (Q1). It represents the range of the middle 50% of the data.
How is the first quartile (Q1) determined?
-The first quartile (Q1) is the value that separates the lowest 25% of the data from the rest. It is found by locating the value at the position of one-quarter of the data set when the data is sorted in ascending order.
How do you find the second quartile (Q2) or median?
-The second quartile (Q2) is the median of the data. To find Q2, arrange the data in ascending order and find the middle value. If there is an even number of data points, average the two middle values.
What does the third quartile (Q3) represent?
-The third quartile (Q3) represents the value that separates the top 25% of the data from the rest. It is found by locating the value at the position of three-quarters of the data when sorted.
What is the formula to find the position of quartiles?
-The position of a quartile is calculated using the formula: (n + 1) / 4 for Q1, 2(n + 1) / 4 for Q2, and 3(n + 1) / 4 for Q3, where 'n' is the number of data points.
Why is it important to sort the data before calculating quartiles?
-It is crucial to sort the data in ascending order before calculating quartiles to ensure that the quartiles divide the data correctly into equal parts.
What does the interquartile range (IQR) tell us about the data?
-The interquartile range (IQR) provides a measure of the spread of the middle 50% of the data, indicating the variability or dispersion of the central values in the data set.
What is the relationship between the range and the interquartile range (IQR)?
-While the range measures the spread between the smallest and largest values in the data set, the interquartile range (IQR) focuses on the spread of the middle 50% of the data, thus being less affected by extreme values or outliers.
Outlines

This section is available to paid users only. Please upgrade to access this part.
Upgrade NowMindmap

This section is available to paid users only. Please upgrade to access this part.
Upgrade NowKeywords

This section is available to paid users only. Please upgrade to access this part.
Upgrade NowHighlights

This section is available to paid users only. Please upgrade to access this part.
Upgrade NowTranscripts

This section is available to paid users only. Please upgrade to access this part.
Upgrade NowBrowse More Related Video

STATISTIKA Part 2- Jangkauan, Kuartil dan Jangkauan interkuartil
Statistika Kelas 8 [Part 4] - Menentukan Jangkauan, Kuartil, dan Jangkauan Interkuartil
Ukuran Penyebaran Data (Jangkauan, Jangkauan Antarkuartil, Simpangan Kuartil) - STATISTIKA Kelas 8

Ukuran Penyebaran Data | Statistika Kelas 8

Statistika 2 ~ Ukuran Penyebaran Data (Jangkauan, Kuartil, Hamparan) ~ Materi PJJ Kelas VIII / 8 SMP

STATISTIKA - Cara mudah menentukan nilai Jangkauan, Jangkauan antarkuartil dan Simpangan kuartil
5.0 / 5 (0 votes)