Ukuran Penyebaran Data (Jangkauan, Jangkauan Antarkuartil, Simpangan Kuartil) - STATISTIKA Kelas 8
Summary
TLDRThis video explains statistical measures for data dispersion, covering range, interquartile range (IQR), and quartile deviation (QD). The presenter introduces formulas for each measure and provides detailed examples for both ordered and unordered datasets, demonstrating how to calculate the range, IQR, and QD. Additionally, the video includes a segment on handling grouped data, using specific formulas for even-numbered data to calculate quartiles. The clear step-by-step approach helps viewers understand and apply these key statistical concepts effectively.
Takeaways
- 😀 The video introduces the concept of measures of data dispersion in statistics, focusing on range, interquartile range, and quartile deviation.
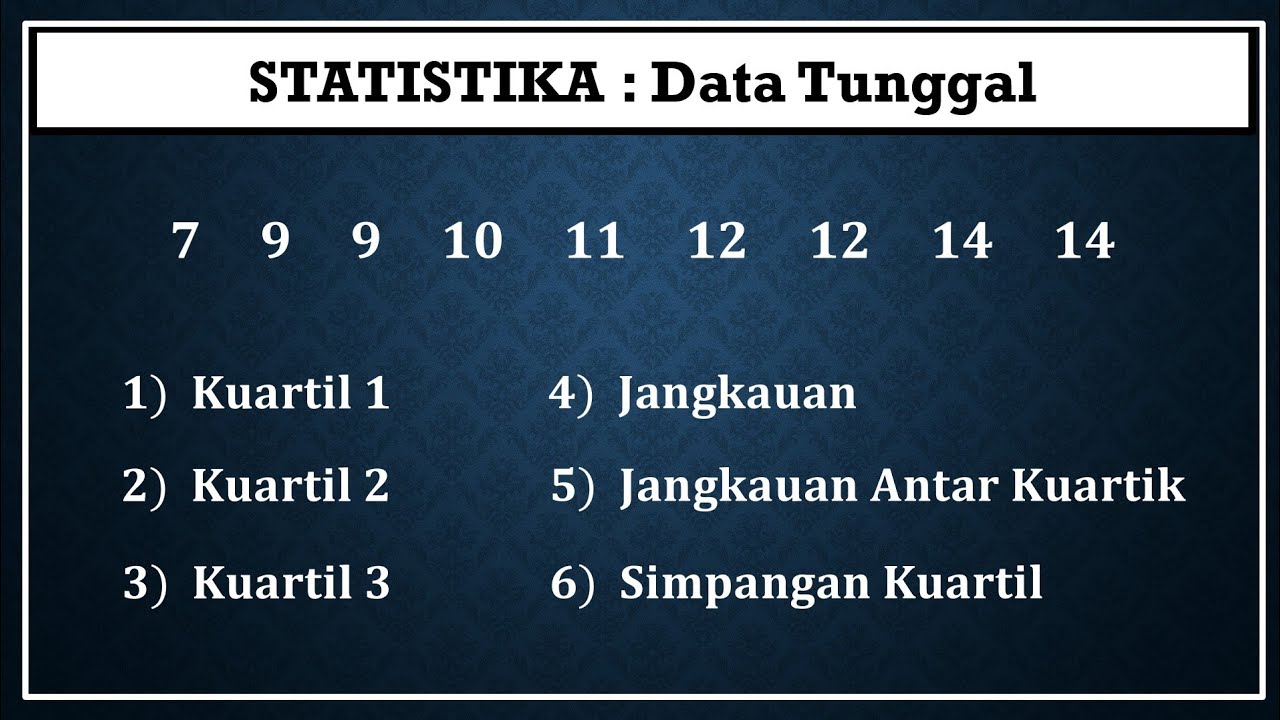
- 😀 The range (Jangkauan) is calculated by subtracting the smallest data point from the largest data point in a dataset.
- 😀 The interquartile range (Jangkauan Antarkuartil) is the difference between the third quartile (Q3) and the first quartile (Q1), helping to measure the spread of the middle 50% of data.
- 😀 Quartile deviation (Simpangan Kuartil) is calculated as half of the interquartile range, which provides an understanding of the variability of data around the median.
- 😀 To find the quartiles (Q1, Q2, Q3), data should be arranged in ascending order before calculating the median and quartiles.
- 😀 The process of determining the quartiles involves finding the middle values of subsets of data, with Q1 being the median of the lower half and Q3 being the median of the upper half of the data.
- 😀 The script provides an example using a data set to calculate the range, interquartile range, and quartile deviation, explaining how to find Q1, Q2, and Q3 step by step.
- 😀 In the case of grouped data, a different formula is used to calculate quartiles, considering the cumulative frequency and number of data points.
- 😀 The quartile values can be calculated using specific formulas for odd and even numbers of data points, depending on the dataset's frequency distribution.
- 😀 The script emphasizes the importance of correct data ordering and applying appropriate formulas when calculating statistical measures for both individual and grouped data.
Q & A
What is the definition of 'Range' in statistics?
-The range is a measure of data dispersion calculated by subtracting the smallest value in a data set from the largest value.
How is the 'Range' calculated?
-The range is calculated using the formula: Range = X_max - X_min, where X_max is the largest value and X_min is the smallest value in the data set.
What does the 'Interquartile Range (IQR)' represent?
-The interquartile range (IQR) measures the spread between the first quartile (Q1) and the third quartile (Q3) of a data set. It focuses on the middle 50% of the data.
What is the formula for calculating the Interquartile Range?
-The formula for calculating the IQR is: IQR = Q3 - Q1, where Q3 is the third quartile and Q1 is the first quartile.
How is 'Quartile Deviation' (QD) calculated?
-Quartile deviation (QD) is calculated as half of the difference between the third quartile (Q3) and the first quartile (Q1), using the formula: QD = 1/2 × (Q3 - Q1).
What is the purpose of calculating Quartile Deviation?
-The purpose of calculating Quartile Deviation is to provide a measure of data spread that focuses on the middle 50% of the data, offering insight into the variability within this range.
What is the significance of finding the median (Q2) in a data set?
-The median (Q2) divides the data set into two equal halves, representing the middle value of the data when arranged in ascending order. It helps in identifying the central tendency of the data.
How do you determine Q1 and Q3 from a data set?
-Q1 is the median of the lower half of the data, and Q3 is the median of the upper half of the data. These quartiles help in dividing the data into four parts, each containing 25% of the data.
What steps are involved in calculating the Interquartile Range for a given data set?
-To calculate the IQR, first order the data, then find Q1 and Q3. Subtract Q1 from Q3 to obtain the IQR. This represents the range where the middle 50% of the data lies.
How does the use of Quartile Deviation improve data analysis?
-Quartile Deviation provides a clearer measure of spread by focusing on the central data range, reducing the impact of extreme values (outliers), and offering a more robust measure of dispersion compared to the range.
Outlines

This section is available to paid users only. Please upgrade to access this part.
Upgrade NowMindmap

This section is available to paid users only. Please upgrade to access this part.
Upgrade NowKeywords

This section is available to paid users only. Please upgrade to access this part.
Upgrade NowHighlights

This section is available to paid users only. Please upgrade to access this part.
Upgrade NowTranscripts

This section is available to paid users only. Please upgrade to access this part.
Upgrade NowBrowse More Related Video

STATISTIKA - Cara mudah menentukan nilai Jangkauan, Jangkauan antarkuartil dan Simpangan kuartil

Ukuran Penyebaran Data Tunggal | Statistika Matematika Wajib Kelas 12 | Catatan Matematika @Bang-RP

Ukuran Penyebaran Data | Statistika Kelas 8
STATISTIKA - Kuartil, Jangkauan, Jangkauan Antar Kuartil Dan Simpangan Kuartil Data Tunggal

Interquartile Range (IQR) | Math with Mr. J

UKURAN PENYEBARAN (DATA TUNGGAL)
5.0 / 5 (0 votes)