Cuartiles, Deciles y Percentiles | Datos agrupados en intervalos | Ejemplo 1
Summary
TLDRThis video provides a detailed explanation on how to calculate quartiles, deciles, and percentiles for grouped data in frequency tables. The presenter walks through examples using a table of the ages of 60 people, explaining the process step by step. Starting with finding the position of a quartile, then applying the formula for deciles and percentiles, the tutorial covers how to determine the value of each measure of position. The video emphasizes understanding the necessary calculations and formulas, ensuring viewers can apply them confidently in their own data analysis.
Takeaways
- 😀 The lesson focuses on how to find quartiles, deciles, and percentiles for grouped data in frequency tables.
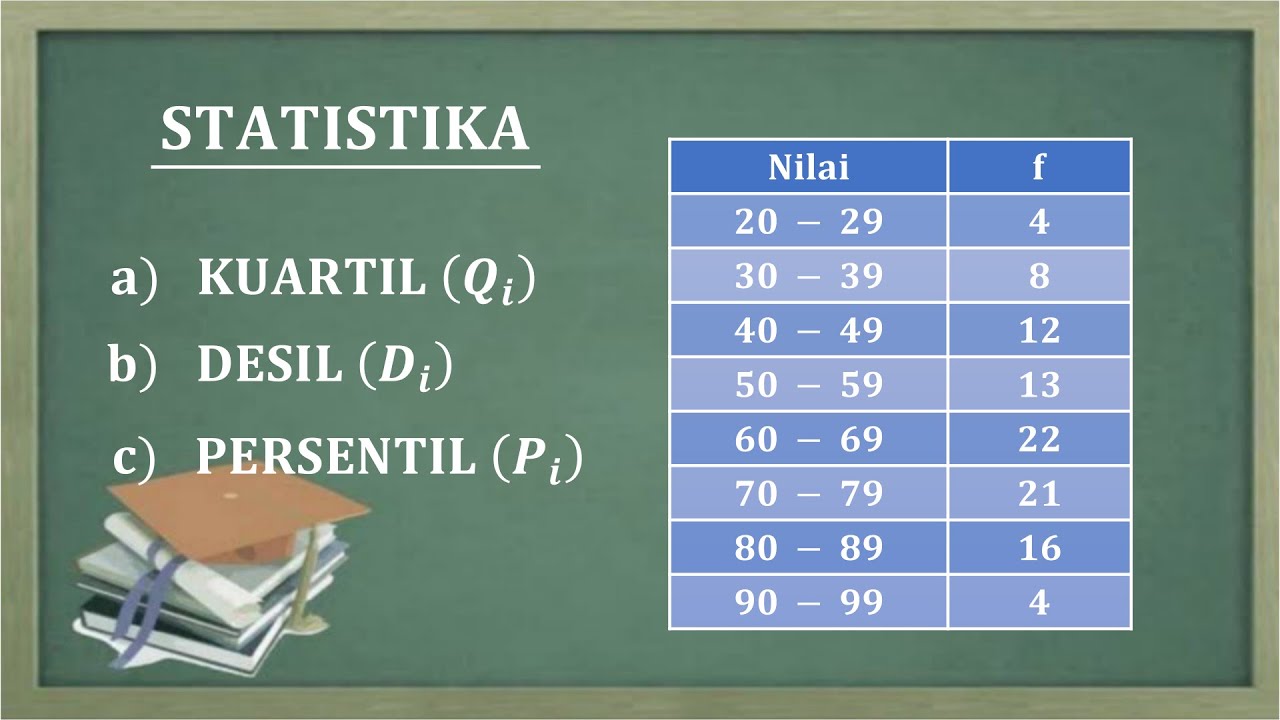
- 😀 The data used in the example represents the ages of 60 people, with frequencies listed for different age intervals.
- 😀 To find quartiles, the key formula involves multiplying the quartile number (K) by the total number of data points (N) and dividing by 4.
- 😀 For quartile 3, the calculation yields a position of 45, which is located within the interval with a limit of 50.
- 😀 The process for finding deciles and percentiles is similar to quartiles, but instead of dividing by 4, you divide by 10 for deciles and 100 for percentiles.
- 😀 The position for the second decile (K=2) is 12, which falls between cumulative frequencies of 10 and 22, indicating the value lies in the interval from 40 to 45.
- 😀 The formula for deciles and percentiles involves calculating the position and then using the frequency values to adjust based on the cumulative frequency intervals.
- 😀 The second decile (D2) is calculated using a specific formula, with the result being approximately 40.83.
- 😀 Percentile 55 is calculated similarly to deciles, with the position formula yielding 33, and the result being approximately 47.39 after applying the necessary adjustments.
- 😀 The video concludes with a practical exercise for the viewers to practice finding the first quartile using the provided method.
- 😀 The instructor encourages viewers to check out the full course on measures of position and to engage with the content by subscribing, commenting, and sharing.
Q & A
What are the measures of position discussed in the video?
-The video discusses quartiles, deciles, and percentiles, which are measures of position used to describe data distributions.
What is the purpose of the frequency table in the video?
-The frequency table in the video is used to represent the ages of 60 people and is essential for calculating quartiles, deciles, and percentiles for grouped data.
How do we calculate the position for quartiles?
-To calculate the position of a quartile, you multiply the quartile number (K) by the total number of data points (N), then divide by 4 for quartiles.
What happens when we find the position of a quartile in the frequency table?
-When we find the position of a quartile in the frequency table, the value corresponding to that position is the limit of the interval containing the quartile, which gives us the quartile value.
What is the formula used for calculating deciles?
-For deciles, the formula is K * N / 10, where K is the decile number, and N is the total number of data points.
How do you calculate the decile value when the position falls between two frequencies?
-When the position falls between two frequencies, you use a formula that incorporates the previous and next frequencies, the interval's lower and upper limits, and the amplitude of the interval.
What changes when calculating percentiles compared to quartiles and deciles?
-For percentiles, the formula divides by 100 instead of 4 or 10, reflecting the different number of divisions in the data.
What is the formula for calculating the position of a specific percentile?
-To calculate the position of a percentile, the formula is K * N / 100, where K is the percentile number, and N is the total number of data points.
How do you calculate a percentile value when the position is between two frequencies?
-Similar to deciles, when the percentile position is between two frequencies, the percentile is calculated using the formula with the previous and next frequencies, the interval limits, and the amplitude.
What was the example for finding quartile 3, decile 2, and percentile 55 in the video?
-The video demonstrates calculating quartile 3 as 50, decile 2 as 40.83, and percentile 55 as 47.39 using the frequency table and corresponding formulas.
Outlines

This section is available to paid users only. Please upgrade to access this part.
Upgrade NowMindmap

This section is available to paid users only. Please upgrade to access this part.
Upgrade NowKeywords

This section is available to paid users only. Please upgrade to access this part.
Upgrade NowHighlights

This section is available to paid users only. Please upgrade to access this part.
Upgrade NowTranscripts

This section is available to paid users only. Please upgrade to access this part.
Upgrade NowBrowse More Related Video
Ukuran Penyebaran Data : Kuartil, Desil dan Persentil + Contoh Soal
KUARTIL DESIL DAN PERSENTIL DATA KELOMPOK

Statistika Bagian 6 - Persentil Data Tunggal dan Data Kelompok Matematika Wajib Kelas 12

UKURAN PEMUSATAN DATA BERKELOMPOK | Rataan Median Modus Kuartil Desil Persentil

MEASURES OF POSITION OF GROUPED DATA | MATHEMATICS IN THE MODERN WORLD

MEASURES OF POSITION FOR UNGROUPED DATA
5.0 / 5 (0 votes)