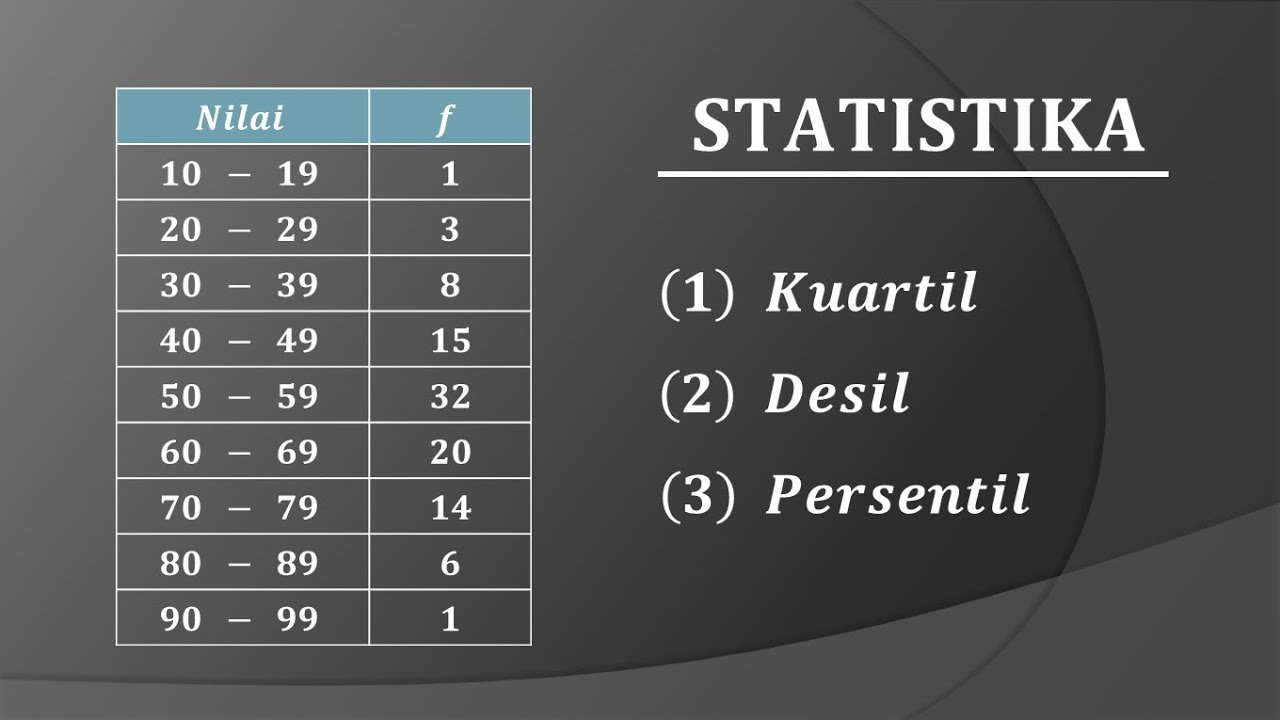
KUARTIL DESIL DAN PERSENTIL DATA KELOMPOK
Summary
TLDRThis video tutorial guides viewers through the process of calculating quartiles, deciles, and percentiles for grouped data. Using step-by-step instructions, it demonstrates how to compute cumulative frequencies, locate specific data points (Q1, Q3, D4, D8, P10, P95), and apply relevant formulas. The video emphasizes the simplicity of the process and provides practical examples to help viewers understand how to work with frequency tables. It is aimed at making statistical calculations accessible, with clear explanations on how to find the desired values in a data set.
Takeaways
- 😀 To find quartiles, percentiles, and deciles for grouped data, you need to first calculate the cumulative frequency (FK) column.
- 😀 To calculate Q1 (the first quartile), use the formula Q1 = 1/4 * n, where 'n' is the total frequency, which helps determine the position of Q1 in the frequency table.
- 😀 For Q3 (the third quartile), use the formula Q3 = 3/4 * n to locate the class interval containing Q3, then use specific formulas to calculate the value.
- 😀 When calculating quartiles or percentiles for grouped data, always subtract 0.5 from the lower boundary of the class containing the required data point.
- 😀 In calculations for grouped data, it's important to know how to find the frequency and cumulative frequency of a class interval, as these values are critical for the formulae.
- 😀 For deciles, the formula is Dk = (k/10) * n, where 'k' is the decile you are looking for, and 'n' is the total frequency.
- 😀 The process of calculating percentiles (e.g., P10, P95) involves identifying the class interval containing the specific percentile and using a similar method as for quartiles and deciles.
- 😀 The class boundaries are used to calculate the cumulative frequency and identify which class interval contains a specific quartile, decile, or percentile.
- 😀 Always pay attention to the exact formula for each type of calculation: for quartiles, it's Q1 = (1/4) * n, for deciles it's Dk = (k/10) * n, and for percentiles, it's Pk = (k/100) * n.
- 😀 Understanding the 'p' (class width) and applying the appropriate formula helps in calculating quartiles, deciles, and percentiles accurately for grouped data.
Q & A
What is the main topic discussed in the video?
-The video discusses how to determine quartiles, deciles, and percentiles for grouped data, with a focus on providing step-by-step examples and calculations.
What is the purpose of the cumulative frequency (FK) column?
-The cumulative frequency (FK) column is used to keep track of the cumulative sum of frequencies, which helps in locating the specific classes where quartiles, deciles, and percentiles fall.
How is the value of the first quartile (Q1) determined?
-To find Q1, the formula Q1 = (1/4) * n is used, where n is the total number of data points. The result is then used to locate the class that contains the Q1 data point.
What role does the formula for Q3 play in the calculation?
-The formula for Q3, Q3 = (3/4) * n, helps determine the position of the third quartile. The result helps in locating the class that contains the Q3 data point.
What is the general formula for calculating quartiles in grouped data?
-The formula for calculating a quartile Qk is Qk = TBk + ((k/4 * n - Fk) / Fk) * P, where TBk is the lower class boundary of the quartile, Fk is the cumulative frequency before the quartile class, and P is the length of the class interval.
How is the class width (P) for quartiles, deciles, and percentiles determined?
-The class width (P) is calculated by finding the difference between the upper and lower boundaries of the class interval. It represents the number of data points in that interval.
What is the formula used to calculate the position of deciles?
-The formula for calculating the position of a decile is Dk = (k/10) * n, where k is the desired decile (1 through 9) and n is the total number of data points.
What is the significance of the number 0.5 in the formula for quartile and decile calculations?
-The number 0.5 is subtracted from the class lower boundary in the formula to account for the fact that the data points are discrete and that we are calculating the exact position of a specific percentile or quartile.
How are percentiles calculated for grouped data?
-Percentiles are calculated using the formula Pk = (k/100) * n, where k is the desired percentile (such as P10 or P95) and n is the total number of data points. The class that contains the corresponding percentile is then located.
What is the main difference between quartiles, deciles, and percentiles?
-Quartiles divide the data into four equal parts, deciles divide the data into ten parts, and percentiles divide the data into one hundred parts. Each measure gives a more granular view of data distribution.
Outlines

This section is available to paid users only. Please upgrade to access this part.
Upgrade NowMindmap

This section is available to paid users only. Please upgrade to access this part.
Upgrade NowKeywords

This section is available to paid users only. Please upgrade to access this part.
Upgrade NowHighlights

This section is available to paid users only. Please upgrade to access this part.
Upgrade NowTranscripts

This section is available to paid users only. Please upgrade to access this part.
Upgrade NowBrowse More Related Video
STATISTIKA : Cara mudah menentukan nilai Quartil Desil dan Persentil data kelompok

MEASURES OF POSITION OF GROUPED DATA | MATHEMATICS IN THE MODERN WORLD

Statistika Bagian 6 - Persentil Data Tunggal dan Data Kelompok Matematika Wajib Kelas 12
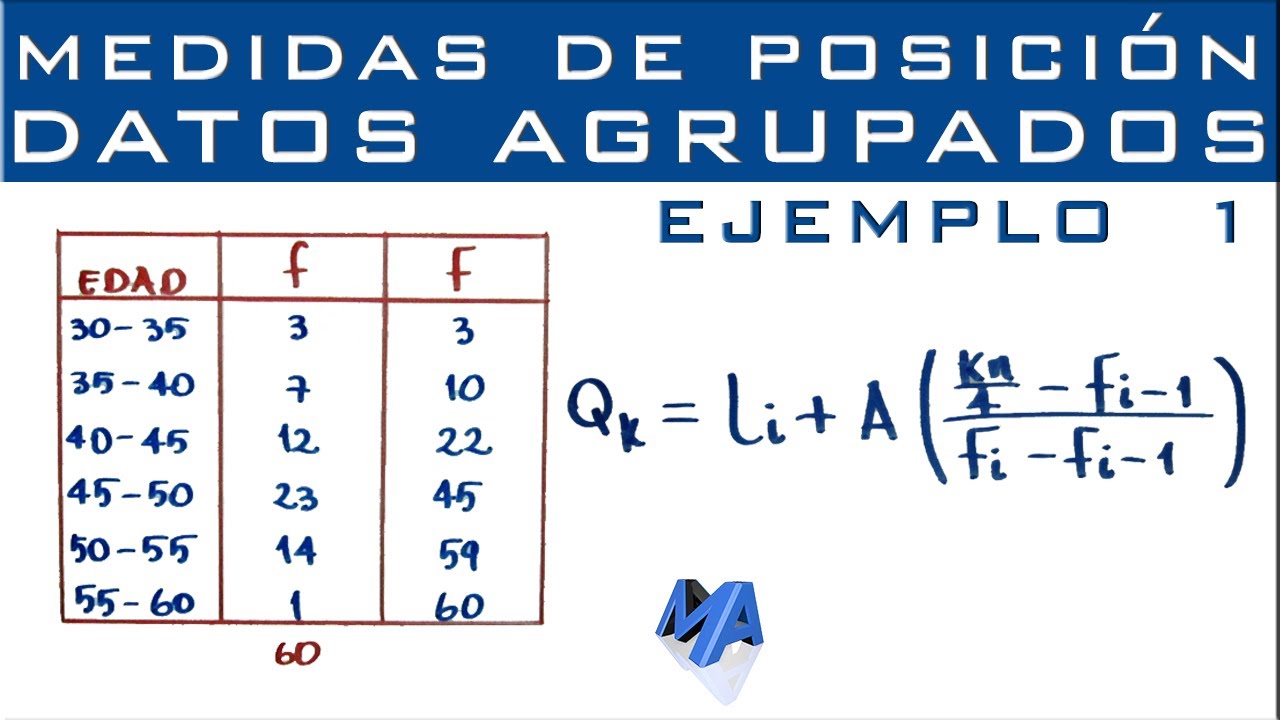
Cuartiles, Deciles y Percentiles | Datos agrupados en intervalos | Ejemplo 1

CARA MENCARI NILAI KUARTIL DESIL PERSENTIL UKURAN LETAK II DATA TUNGGAL

UKURAN PEMUSATAN DATA BERKELOMPOK | Rataan Median Modus Kuartil Desil Persentil
5.0 / 5 (0 votes)