Menentukan Nilai Validitas dan Reliabilitas Soal Pilihan Ganda Menggunakan SPSS
Summary
TLDRThis video script provides a comprehensive guide on how to calculate the validity and reliability of a test instrument using SPSS. The speaker demonstrates step-by-step how to input data, perform bivariate correlation analysis to check the validity of each test item, and calculate Cronbach’s Alpha for reliability. Items with a p-value below 0.05 are considered valid, and reliability is deemed acceptable if Cronbach’s Alpha exceeds 0.70. The tutorial serves as an essential resource for researchers looking to ensure the accuracy and consistency of their survey instruments.
Takeaways
- 😀 The script explains the process of calculating the validity and reliability of survey data using SPSS.
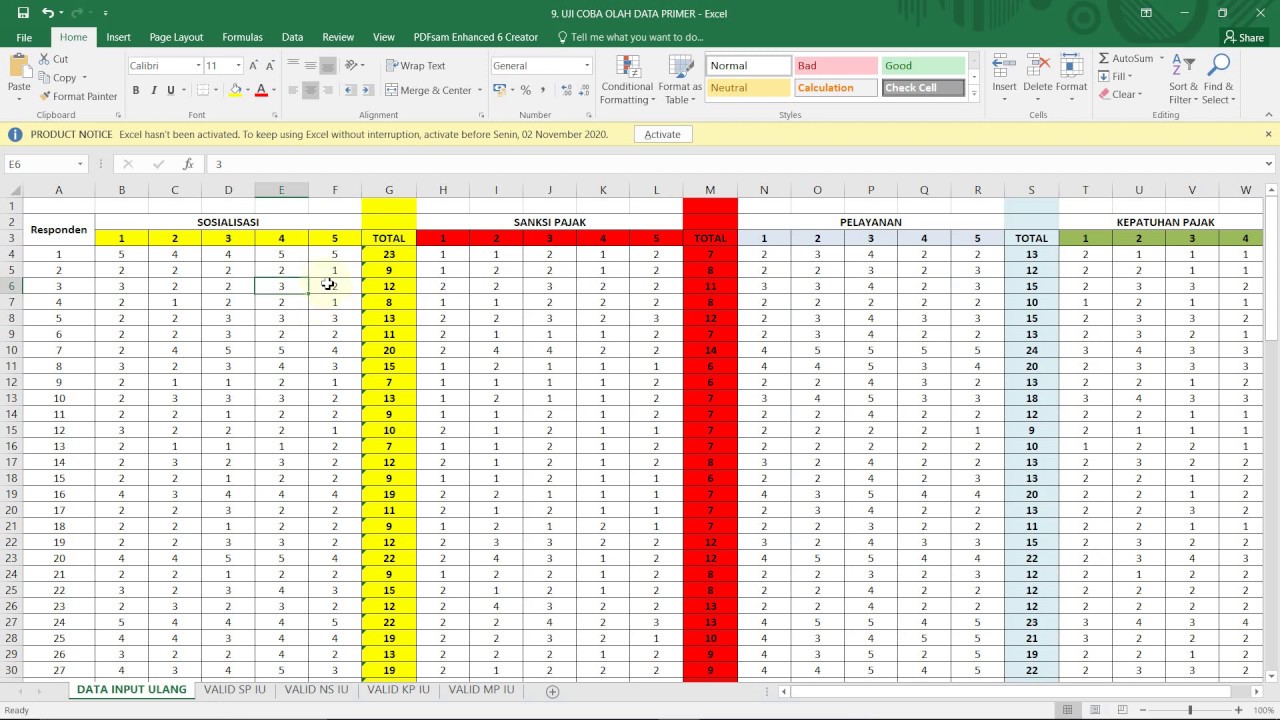
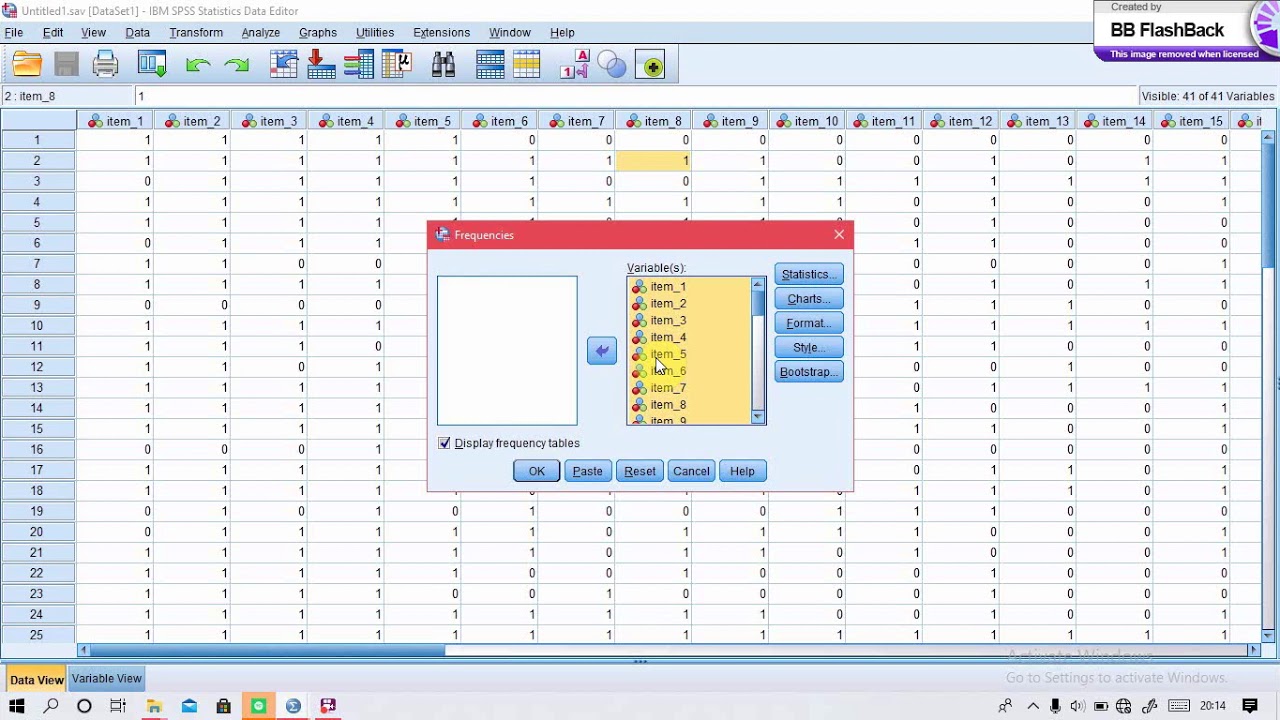
- 😀 It demonstrates how to input data into SPSS, where correct answers are marked as '1' and incorrect answers as '0'.
- 😀 The data is organized with 25 questions, and the performance of 20 students is tracked across these questions.
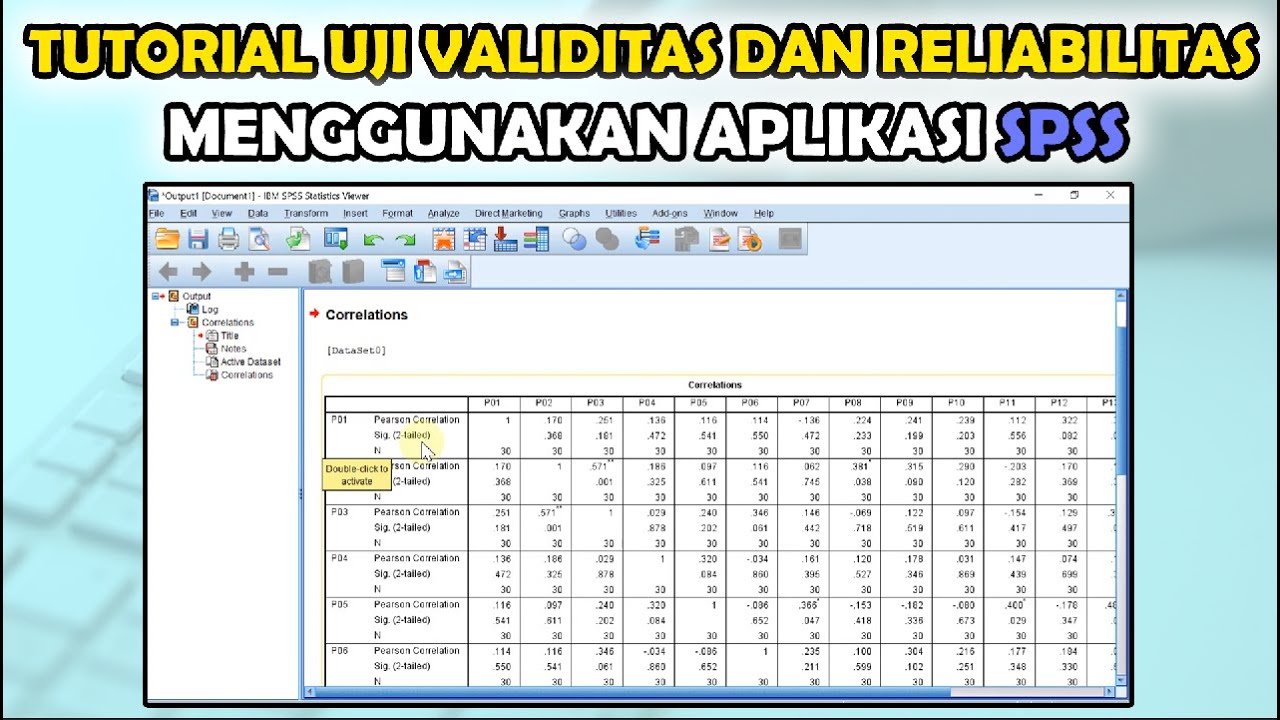
- 😀 Validity is tested using **Pearson's Correlation**, and questions are deemed valid if the p-value is less than 0.05.
- 😀 The script emphasizes the importance of proper data formatting, especially when inputting data into SPSS for analysis.
- 😀 **Reliability** is evaluated using **Cronbach's Alpha**, with a threshold value of 0.7 to determine if the instrument is reliable.
- 😀 The **Bivariate Correlation Analysis** in SPSS is used to calculate validity, showing which questions are statistically significant.
- 😀 Questions with a significance value below 0.05 are categorized as valid and included in the final analysis.
- 😀 After performing the analysis, 16 out of 25 questions were determined to be valid based on their p-values.
- 😀 The Cronbach's Alpha value obtained (0.72) confirms that the test instrument is reliable, meaning it can produce consistent results in further studies.
- 😀 The session concludes with a recap of the valid questions (16 out of 25) and the instrument's high reliability (Cronbach's Alpha of 0.72).
Q & A
What is the purpose of calculating validity and reliability in a research instrument?
-The purpose is to assess whether the test items are measuring what they are intended to measure (validity) and whether the test produces consistent results across different instances (reliability).
How are correct and incorrect answers encoded in the data?
-Correct answers are encoded as '1' and incorrect answers as '0' for each test item, allowing for easier analysis in SPSS.
What steps are involved in inputting the data into SPSS?
-First, the variables (questions) are created in SPSS without spaces, using underscores for separation. Then, the data for each student's responses are entered in the Data View section.
How do you conduct a validity test using SPSS?
-You conduct a validity test by using the 'Analyze' function in SPSS, selecting 'Correlate', then 'Bivariate', and ensuring that the 'Pearson correlation coefficient' is chosen to measure the relationship between the variables.
What does the significance value (p-value) in the correlation output represent?
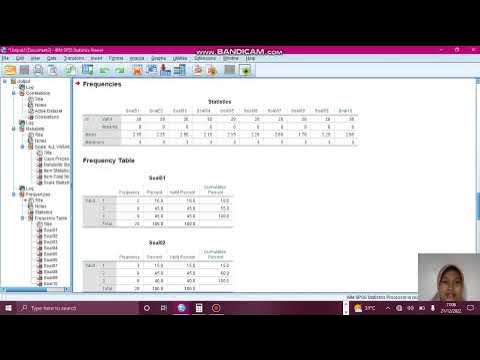
-The significance value indicates whether the correlation between each item and the total score is statistically significant. If the p-value is less than 0.05, the item is considered valid.
How do you interpret the correlation coefficients for validity?
-A correlation coefficient between 0.8 and 1 indicates a 'very high' validity, between 0.6 and 0.79 indicates 'high' validity, 0.4 to 0.59 indicates 'adequate' validity, and below 0.4 suggests 'low' validity.
How is reliability calculated in SPSS?
-Reliability is calculated using the 'Reliability Analysis' option in SPSS, where all items are selected, and the 'Cronbach Alpha' model is chosen. The result, Cronbach's Alpha, indicates the internal consistency of the instrument.
What does a Cronbach's Alpha value above 0.7 indicate?
-A Cronbach's Alpha value above 0.7 indicates that the instrument is reliable, meaning it consistently measures the construct it is intended to measure.
What is the significance of a p-value below 0.05 in the validity test?
-A p-value below 0.05 suggests that the test item is statistically significant and can be considered valid. This means the item has a meaningful correlation with the overall test performance.
How are the results of the validity test used to interpret the quality of the test items?
-Test items with a p-value less than 0.05 are considered valid. Items with correlation coefficients in the 'adequate' range (0.4-0.59) may still be used, but items in the 'low' validity range (below 0.4) should be reviewed or excluded.
Outlines

This section is available to paid users only. Please upgrade to access this part.
Upgrade NowMindmap

This section is available to paid users only. Please upgrade to access this part.
Upgrade NowKeywords

This section is available to paid users only. Please upgrade to access this part.
Upgrade NowHighlights

This section is available to paid users only. Please upgrade to access this part.
Upgrade NowTranscripts

This section is available to paid users only. Please upgrade to access this part.
Upgrade NowBrowse More Related Video

Cara Uji Validitas dan Reliabilitas kuesioner penelitian menggunakan aplikasi SPSS
BELAJAR UJI VALIDITAS DAN RELIABILITAS DATA PRIMER DENGAN SPSS (Bagian 1)
validitas, reliabilitas, tingkat kesukaran dan daya pembeda menggunakan aplikasi SPSS 26.
UJI VALIDITAS, RELIABILITAS, TINGKAT KESUKARAN DAN DAYA PEMBEDA SOAL TIPE URAIAN

Uji Butir Soal Pilihan Ganda dengan Excel
Cara Uji Validitas dan Reliabilitas Kuesioner Menggunakan Aplikasi SPSS | Tutorial SPSS
5.0 / 5 (0 votes)