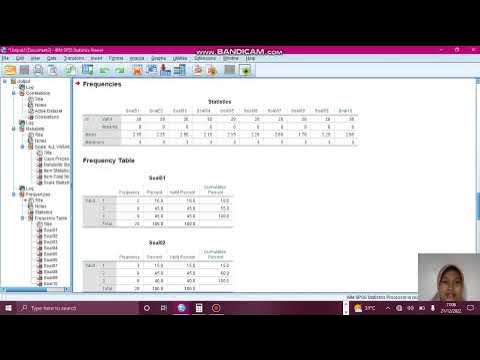
validitas, reliabilitas, tingkat kesukaran dan daya pembeda menggunakan aplikasi SPSS 26.
Summary
TLDRThis tutorial demonstrates how to analyze data using SPSS version 26, focusing on validity, reliability, difficulty, and discriminative power of test items. The presenter walks through the steps to perform these analyses, including checking item validity using correlation coefficients, calculating reliability using Cronbach's Alpha, and assessing item difficulty and discrimination with descriptive statistics. Key concepts like item significance levels (p-values), reliability thresholds, and difficulty ranges are explained, providing a clear and practical guide for using SPSS to evaluate test quality.
Takeaways
- 😀 Validity of test items is determined using the correlation coefficients. Items with a correlation of 0.05 or 0.01 are considered valid.
- 😀 Items with one-star (0.05 significance level) or two-star (0.01 significance level) correlations are considered valid.
- 😀 An item with a correlation of 0.24 or below is deemed invalid, requiring removal from the analysis.
- 😀 Reliability of the instrument is assessed using Cronbach's Alpha. A coefficient above 0.6 indicates acceptable reliability.
- 😀 The overall reliability coefficient of 0.875 suggests that the instrument used in the analysis is highly reliable.
- 😀 To assess the difficulty level of test items, the p-value range is used: above 0.9 is very easy, 0.7-0.9 is easy, 0.3-0.7 is medium, and below 0.3 is difficult.
- 😀 For instance, items with difficulty levels of 0.86 and 0.95 are considered easy, while items with lower values are more challenging.
- 😀 Discriminating power of items is analyzed by reviewing their correlation with total scores. Items with correlations above 0.4 are considered strong discriminators.
- 😀 Items with correlation coefficients in the range of 0.2-0.3 are considered to have average discriminating power.
- 😀 SPSS version 26 is used for all analyses, including reliability, difficulty, and discriminating power analysis, using commands like 'Analyze' and 'Reliability Analysis'.
Q & A
What is the first step in analyzing the test data using SPSS?
-The first step is to analyze the validity of the test items by checking the correlation between each item and the total score. This is done using the 'Live Score' icon and reviewing the correlation results for significance.
What do the symbols (one star and two stars) indicate in the validity analysis?
-The one-star symbol indicates a significance level of 0.05%, while the two-star symbol indicates a significance level of 0.01%. Both signify that the item is valid if the correlation is significant.
How is the reliability of the test determined in SPSS?
-Reliability is assessed using the 'Reliability Analysis' function in SPSS. The Cronbach’s alpha coefficient is calculated, and a value above 0.6 is considered to indicate acceptable reliability. In the script, a coefficient of 0.875 is mentioned, indicating high reliability.
What does a Cronbach’s alpha value above 0.6 signify?
-A Cronbach’s alpha value above 0.6 indicates that the test has good reliability, meaning the items in the test are consistent in measuring what they are intended to measure.
How is the difficulty level of the test items assessed?
-The difficulty level of the test items is assessed using descriptive statistics and frequency analysis in SPSS. Items are categorized as easy, medium, or difficult based on their difficulty index. Items with a value below 0.3 are considered difficult, 0.31-0.70 are medium, and above 0.7 are easy.
What does a difficulty index of 0.86 indicate about an item?
-A difficulty index of 0.86 indicates that the item is too easy. It falls in the range of difficulty values above 0.7, which suggests that most test-takers answered it correctly.
What does item discrimination refer to in test analysis?
-Item discrimination refers to how well an item differentiates between high and low scorers on the test. It is assessed by checking the item-total correlation; higher correlations (usually above 0.2) indicate that the item effectively discriminates between different groups of test-takers.
How are items with poor discrimination identified?
-Items with poor discrimination are identified by their low item-total correlations. In the script, it is noted that an item with a correlation below 0.2 may not effectively discriminate between high and low scorers.
What is the significance of the 'item-total correlation' in the analysis?
-The item-total correlation is used to measure how well an individual test item correlates with the overall test score. A higher correlation indicates that the item contributes meaningfully to the test's ability to differentiate between test-takers with different levels of ability.
What should be done if an item is found to be invalid during the analysis?
-If an item is found to be invalid (as indicated by low or no correlation with the total score), it should be excluded from further analysis, particularly in the reliability and difficulty level assessments.
Outlines

This section is available to paid users only. Please upgrade to access this part.
Upgrade NowMindmap

This section is available to paid users only. Please upgrade to access this part.
Upgrade NowKeywords

This section is available to paid users only. Please upgrade to access this part.
Upgrade NowHighlights

This section is available to paid users only. Please upgrade to access this part.
Upgrade NowTranscripts

This section is available to paid users only. Please upgrade to access this part.
Upgrade NowBrowse More Related Video

UJI VALIDITAS, RELIABILITAS, TINGKAT KESUKARAN DAN DAYA PEMBEDA SOAL TIPE URAIAN

Dongeng tentang uji validitas Cara uji validitas spss 23, cara baca output

Uji Butir Soal Pilihan Ganda dengan Excel

Menentukan Nilai Validitas dan Reliabilitas Soal Pilihan Ganda Menggunakan SPSS

Cara Uji Validitas dan Reliabilitas dengan SPSS FULL

Uji Validitas dan Reliabilitas dengan EXCEL - Uji Validitas Pearson Correlation
5.0 / 5 (0 votes)