Quartile, Decile and Percentile for grouped data
Summary
TLDRThis video tutorial explains how to calculate quartiles, deciles, and percentiles for grouped data using a step-by-step approach. By walking through a real-world example involving the lifetimes of eight light bulbs, the video demonstrates how to apply formulas to find the third quartile (Q3), the fourth decile (D4), and the 70th percentile (P70). It covers concepts such as class boundaries, cumulative frequency, and class width, providing viewers with a clear understanding of how to interpret and calculate these statistical measures in a practical setting.
Takeaways
- 😀 The formula for calculating quartiles, deciles, and percentiles in grouped data involves using k, the class boundaries, cumulative frequency, frequency, and class width.
- 😀 The value of k is calculated differently depending on whether you're finding a quartile (i/4), decile (i/10), or percentile (i/100).
- 😀 The lower boundary for the quartile, decile, or percentile class is denoted by L, and it is crucial for the calculations.
- 😀 To find the cumulative frequency, you sum the frequencies from the lowest class up to the class in question.
- 😀 The key variables in the formula for finding quartiles, deciles, and percentiles include k, n (total observations), f (frequency of the relevant class), and cf (cumulative frequency of the class before).
- 😀 The class boundaries are found by subtracting 0.5 from the lower class limit and adding 0.5 to the upper class limit.
- 😀 The class width (w) is found by subtracting the lower class limit of one class from the lower class limit of the next class or by subtracting the upper class limits.
- 😀 The 3rd quartile (Q3) is the value at k = 3/4, which represents the point where 75% of the data falls below it.
- 😀 Deciles divide the data into ten equal parts, and D4 corresponds to the point where 40% of the data falls below it.
- 😀 Percentiles are used to divide the data into 100 equal parts, and P70 represents the point where 70% of the data is below it.
Q & A
What is the formula for finding quartiles, percentiles, and deciles for grouped data?
-The formula is given by k = i/N, where k is the position of the desired quartile, decile, or percentile, and i is the index (i.e., 1 to 3 for quartiles, 1 to 9 for deciles, 1 to 99 for percentiles). N represents the total number of observations.
What is the significance of the variable 'k' in the formula?
-'k' represents the relative position of the desired quartile, decile, or percentile in the dataset. It is calculated by dividing the index 'i' by the total number of observations (N), such as i/4 for quartiles, i/10 for deciles, and i/100 for percentiles.
How do you calculate the cumulative frequency for grouped data?
-The cumulative frequency is calculated by adding the frequencies of each class starting from the first class. Each subsequent class's cumulative frequency is the sum of its frequency and all previous class frequencies.
How do you determine the class that contains the desired observation when calculating quartiles, deciles, or percentiles?
-You identify the smallest cumulative frequency that is greater than or equal to the calculated position 'kN'. The class corresponding to this cumulative frequency contains the desired observation.
What is the importance of the class width in the formula?
-The class width (w) is crucial because it determines the size of each class interval. It is calculated by subtracting the lower class limit of one class from the lower class limit of the next class, or by subtracting the upper class limit of one class from the upper class limit of the next class.
How is the lower class boundary used in the calculations?
-The lower class boundary (L) is used in the formula to adjust the position of the desired observation within the class. It is typically the lower limit of the class, adjusted by subtracting 0.5 to ensure more accurate positioning.
In the example, how do you compute the value for Quartile 3 (Q3)?
-To find Quartile 3, the formula k = i/4 is used, where i = 3. After calculating k = 3/4 × N, which gives the position of the 60th observation, the class containing this observation is identified. The formula is then applied with the relevant values for the lower class boundary, cumulative frequency, frequency, and class width, resulting in Quartile 3 = 95.89.
How do you compute the value for Decile 4 (D4) in the example?
-To calculate Decile 4, the formula k = i/10 is used with i = 4. After calculating k = 4/10 × N, which gives the position of the 32nd observation, the class containing this observation is identified. The formula is applied to this class, resulting in Decile 4 = 80.66.
What is the process for calculating Percentile 70 in the example?
-To calculate Percentile 70, the formula k = i/100 is used with i = 70. After calculating k = 70/100 × N, which gives the position of the 56th observation, the class containing this observation is identified. The formula is applied with the appropriate values, resulting in Percentile 70 = 93.44.
Why are the class boundaries adjusted by 0.5 when calculating the class limits?
-The class boundaries are adjusted by 0.5 to ensure that the boundaries are more precise, as the frequency distribution represents grouped data. This adjustment prevents overlap or gaps between adjacent classes when calculating positions for quartiles, percentiles, or deciles.
Outlines

This section is available to paid users only. Please upgrade to access this part.
Upgrade NowMindmap

This section is available to paid users only. Please upgrade to access this part.
Upgrade NowKeywords

This section is available to paid users only. Please upgrade to access this part.
Upgrade NowHighlights

This section is available to paid users only. Please upgrade to access this part.
Upgrade NowTranscripts

This section is available to paid users only. Please upgrade to access this part.
Upgrade NowBrowse More Related Video
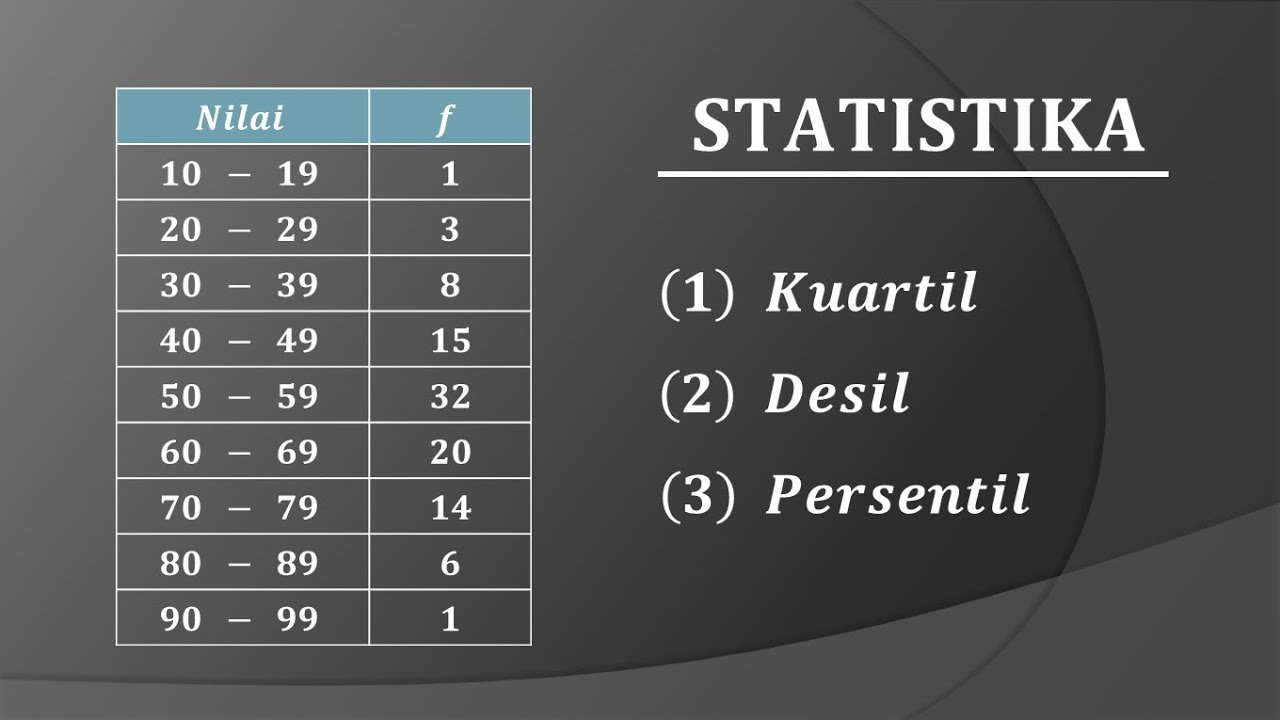
STATISTIKA : Cara mudah menentukan nilai Quartil Desil dan Persentil data kelompok

MEASURES OF POSITION OF GROUPED DATA | MATHEMATICS IN THE MODERN WORLD

UKURAN PEMUSATAN DATA BERKELOMPOK | Rataan Median Modus Kuartil Desil Persentil
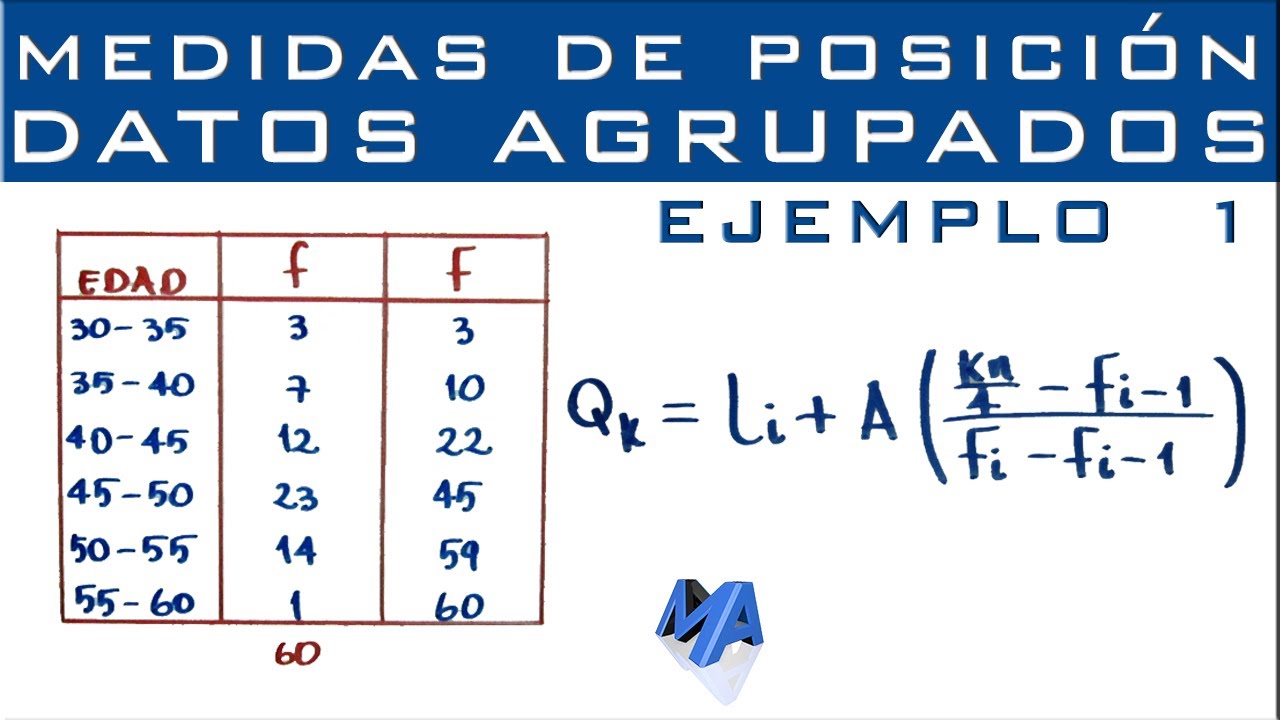
Cuartiles, Deciles y Percentiles | Datos agrupados en intervalos | Ejemplo 1
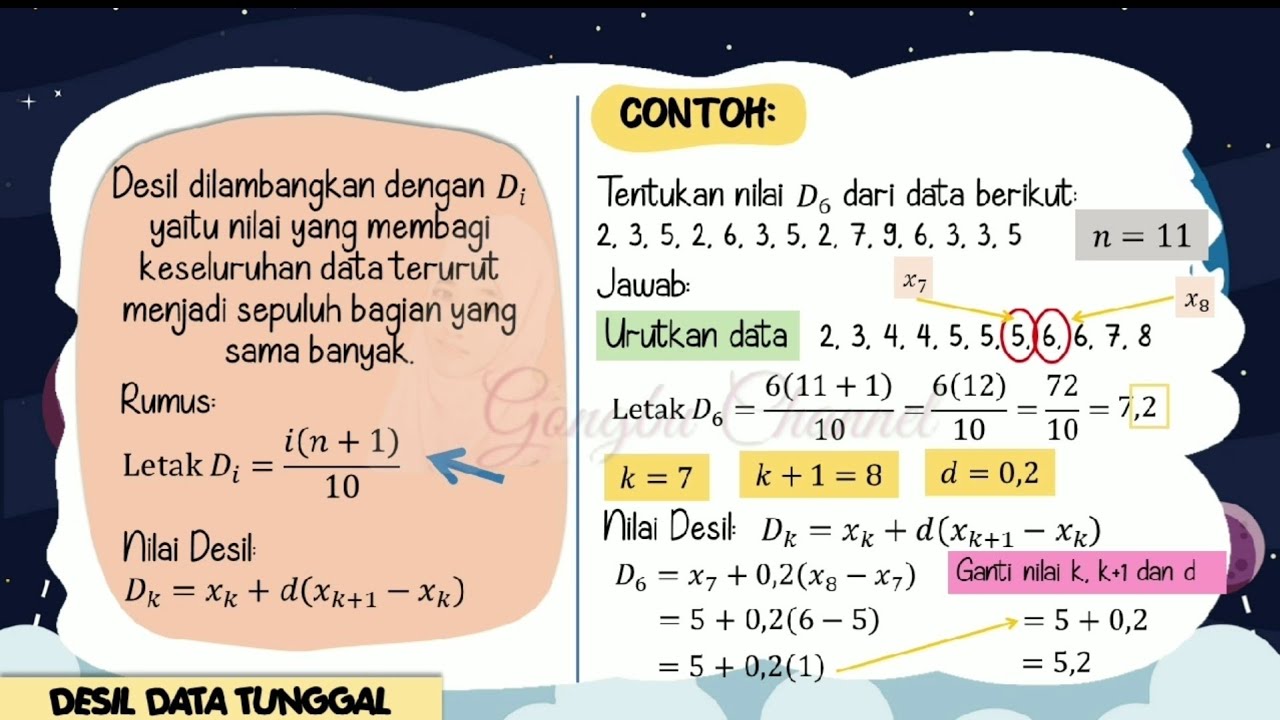
Ukuran Letak Data Tunggal (Kuartil, Desil dan Persentil)
QUARTILES, DECILES AND PERCENTILES OF UNGROUPED DATA || GRADE 10 MATHEMATICS Q4
5.0 / 5 (0 votes)