QUARTILES, DECILES AND PERCENTILES OF UNGROUPED DATA || GRADE 10 MATHEMATICS Q4
Summary
TLDRThis video tutorial covers how to compute quartiles, deciles, and percentiles for ungrouped data, explaining the concept of measures of position. It details various methods, including the general method, linear interpolation, and Mendelhold and synthetic methods. The lesson walks through practical examples to find quartiles, deciles, and percentiles for different datasets, emphasizing the importance of arranging data in ascending order and using formulas for precise calculations. It also demonstrates how to calculate interquartile range, percentile rank, and other related concepts, providing clear step-by-step guidance for learners.
Takeaways
- 😀 Measures of position, such as quartiles, deciles, and percentiles, help determine where a specific score stands relative to others in a data set.
- 😀 Quartiles divide data into four equal parts, with the first quartile representing the 25th percentile, the second quartile representing the median (50th percentile), and the third quartile representing the 75th percentile.
- 😀 The interquartile range (IQR) is the difference between the third and first quartiles, which helps assess the spread of the middle 50% of the data.
- 😀 Deciles divide the data into 10 equal parts, with each decile representing 10% of the data distribution.
- 😀 The second decile (D2) corresponds to the 20th percentile, and each subsequent decile corresponds to 10% increments in the data distribution.
- 😀 Percentiles divide the data into 100 equal parts, with the 50th percentile equivalent to the median, and percentiles representing specific data points like the 43rd, 60th, and 75th percentiles.
- 😀 When calculating quartiles for a data set, the data should be arranged in ascending order first before identifying the middle value (median) and the quartiles.
- 😀 Linear interpolation can be used to find exact values for certain percentiles or deciles that don’t fall directly on a data point.
- 😀 Percentile rank is the percentage of values below a given score in a data set, calculated using a formula involving the number of values less than the given score.
- 😀 To compute specific percentiles like the 43rd, 60th, or 75th percentiles, multiply the percentile by the total number of data points and divide by 100, then round if necessary.
Q & A
What are measures of position and why are they important?
-Measures of position are numbers that indicate where a specific score stands in relation to others in a dataset. They are useful for determining whether a value is about average or unusually high or low. These measures can be applied to quantitative data and ordinal variables, which involve ranking orders.
What are the three methods used to compute measures of position for ungrouped data?
-The three methods for computing measures of position for ungrouped data are: the general method, linear interpolation, and the Mendelhold and Synthetic method.
What are quartiles and how are they used?
-Quartiles are score points that divide a distribution into four equal parts. They are used to assess the spread and central tendency of data, with the first quartile (Q1) marking 25% of data below it, the second quartile (Q2, or median) at 50%, and the third quartile (Q3) at 75%. These values help identify the relative position of data points.
How is the interquartile range (IQR) computed?
-The interquartile range (IQR) is computed by subtracting the first quartile (Q1) from the third quartile (Q3). It represents the range of the middle 50% of data.
What is the significance of the second quartile (Q2)?
-The second quartile (Q2) is the median of the dataset, representing the 50th percentile. It divides the data into two equal halves, with 50% of the data falling below it and 50% above it.
How do you compute the deciles for ungrouped data?
-To compute the deciles, the dataset is divided into 10 equal parts. The deciles indicate the position of a score within these divisions. For instance, the first decile marks 10% of the distribution, while the fifth decile corresponds to the median (50%).
What is the third decile, and how is it determined?
-The third decile (D3) corresponds to the 30th percentile of the data. It is determined by using the formula 'k * n / 10' where 'k' is the decile number, and 'n' is the total number of data points. The position of the third decile is found by identifying the third element in the ordered dataset.
How are percentiles calculated for ungrouped data?
-Percentiles divide the dataset into 100 equal parts. For example, the 50th percentile is the median, while other percentiles, such as the 43rd, 60th, and 75th, correspond to different positions in the ordered data. The formula used to compute a percentile is 'k * n / 100,' where 'k' is the percentile and 'n' is the number of data points.
What is the formula for calculating the percentile rank of a given score?
-The formula for calculating the percentile rank of a score is: (number of values below the score + 0.5) / n * 100, where 'n' is the total number of observations in the dataset.
How do you calculate the percentile rank of a score of 38 in a dataset of 7 values?
-To calculate the percentile rank of the score 38 in a dataset of 7 values, first count the number of values below 38. In this case, 3 values are below 38. The formula then is (3 + 0.5) / 7 * 100, which results in a percentile rank of 50.
Outlines

This section is available to paid users only. Please upgrade to access this part.
Upgrade NowMindmap

This section is available to paid users only. Please upgrade to access this part.
Upgrade NowKeywords

This section is available to paid users only. Please upgrade to access this part.
Upgrade NowHighlights

This section is available to paid users only. Please upgrade to access this part.
Upgrade NowTranscripts

This section is available to paid users only. Please upgrade to access this part.
Upgrade NowBrowse More Related Video

MEASURES OF POSITION FOR UNGROUPED DATA
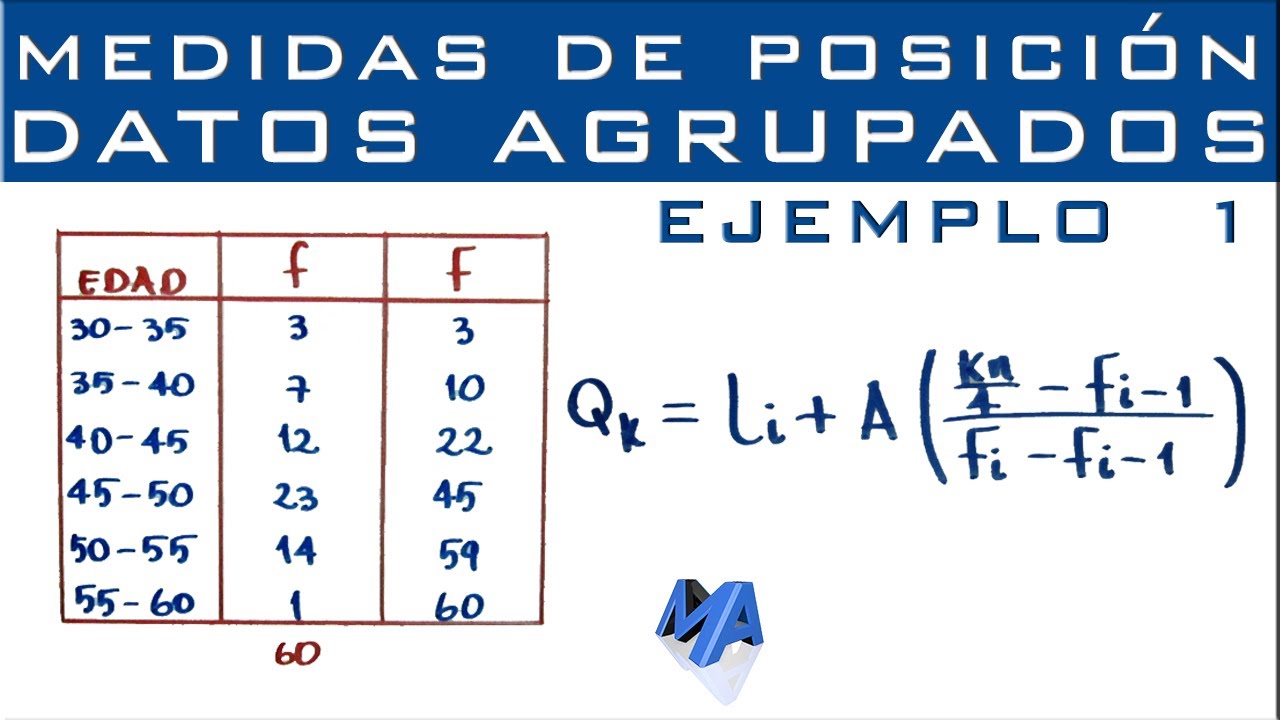
Cuartiles, Deciles y Percentiles | Datos agrupados en intervalos | Ejemplo 1

Ukuran Penyebaran Data : Kuartil, Desil dan Persentil + Contoh Soal
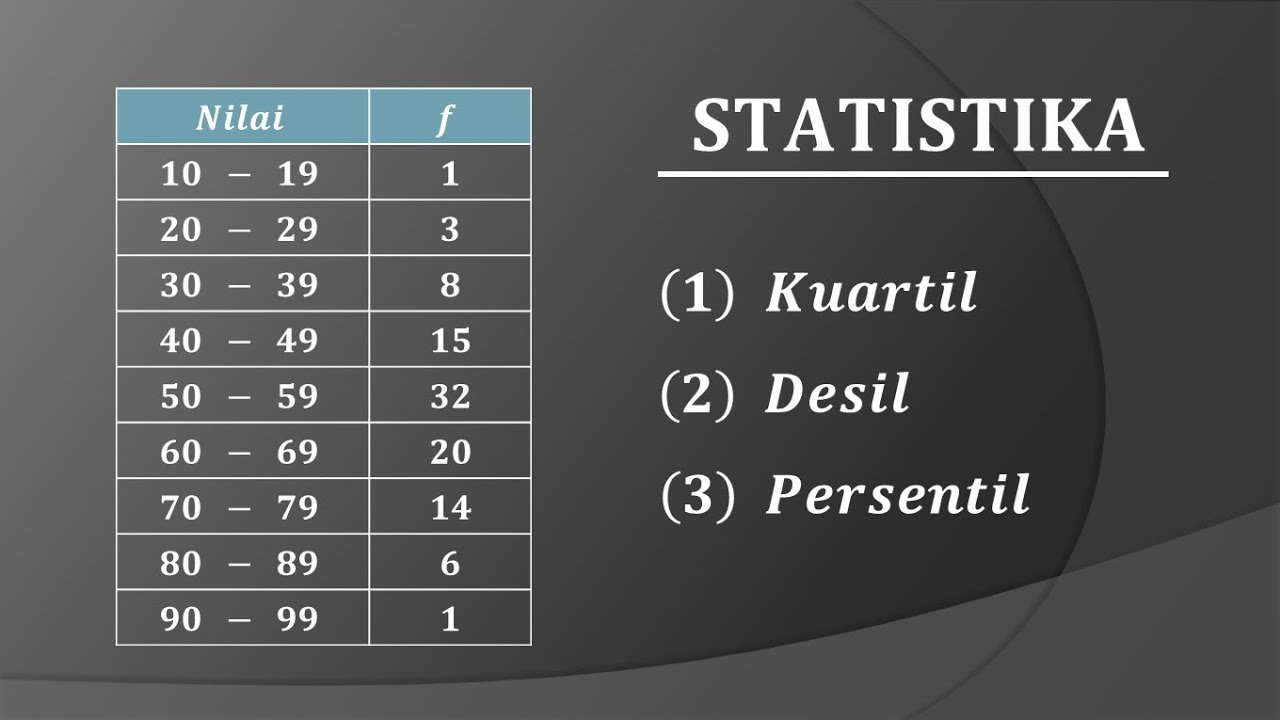
STATISTIKA : Cara mudah menentukan nilai Quartil Desil dan Persentil data kelompok
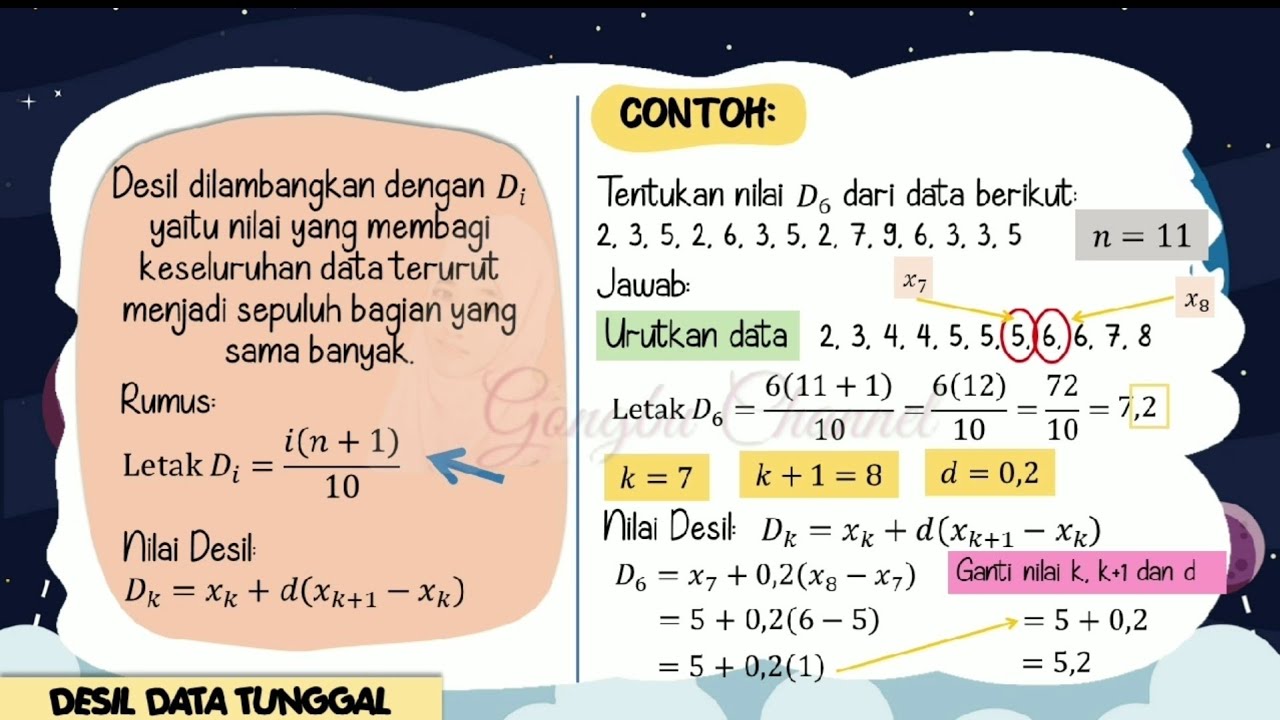
Ukuran Letak Data Tunggal (Kuartil, Desil dan Persentil)

Kuliah Statistika Terapan - Pemusatan Data Sesi 2 Ep.04
5.0 / 5 (0 votes)