MENGUBAH DATA TUNGGAL MENJADI DATA KELOMPOK (TABEL DISTRIBUSI FREKUENSI)
Summary
TLDRThis video tutorial explains how to convert single data into grouped data in statistics, focusing on high school students. It covers key steps such as determining the range, calculating the number of classes using Sturges' rule, finding the class interval, and constructing the frequency table. The tutorial also walks through an example using student test scores, providing a clear and practical guide on organizing data into classes. The presenter emphasizes the importance of these steps for better data analysis, encouraging viewers to subscribe and engage with the video.
Takeaways
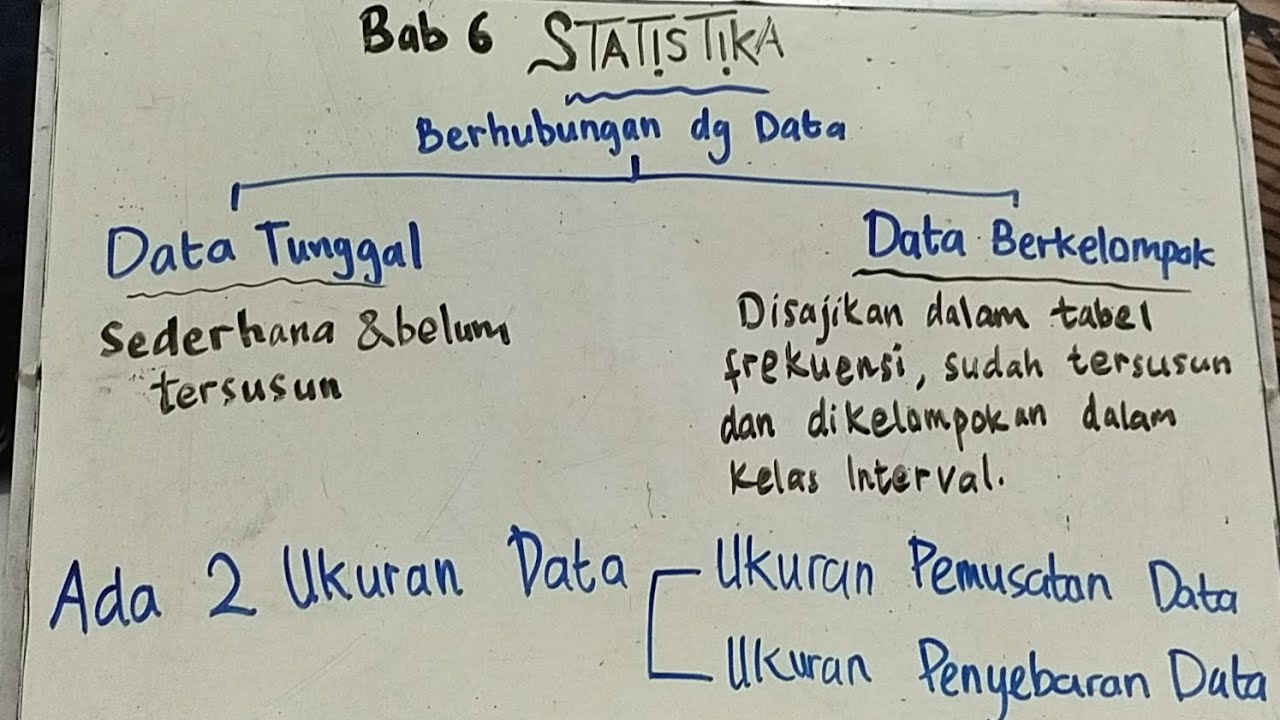
- 😀 Single data consists of values listed individually, while grouped data organizes values into intervals.
- 😀 The range of data is found by subtracting the smallest value from the largest value in the dataset.
- 😀 To determine the number of classes (intervals), use the formula: k = 1 + 3.3 log n, where 'n' is the number of data points.
- 😀 The class width or interval size is calculated by dividing the range by the number of classes.
- 😀 After determining the number of classes and class width, data is organized into intervals.
- 😀 For example, when converting test scores, the largest value is 98, and the smallest is 38, yielding a range of 60.
- 😀 With 80 data points, the formula gives 7 classes. The class width (interval size) is calculated as approximately 9.
- 😀 The first interval starts from the smallest value (38), and subsequent intervals increase by the class width.
- 😀 Each interval is then populated with the corresponding frequency, which is the number of data points that fall within each interval.
- 😀 The final result is a frequency distribution table that clearly shows the grouped data and its frequencies, making analysis easier.
- 😀 If any uncertainties arise during the process, viewers are encouraged to leave questions in the comments section for further clarification.
Q & A
What is the difference between single data and grouped data?
-Single data is listed one by one, while grouped data is presented in the form of intervals, often accompanied by frequency counts.
How is the range (jangkauan) of a data set calculated?
-The range is calculated by subtracting the smallest value from the largest value in the data set.
How do you determine the number of classes for grouped data?
-The number of classes (k) is determined using Sturges' rule, which is k = 1 + 3.3 * log(n), where n is the number of data points.
How do you determine the class width (interval length) for grouped data?
-The class width (interval length) is calculated by dividing the range by the number of classes.
What are the steps to convert single data into grouped data?
-The steps are: 1) Calculate the range, 2) Determine the number of classes using Sturges' rule, 3) Calculate the class width, 4) Create the table and input the data into intervals.
In the given example, what is the range of the data set?
-The range is 60, calculated by subtracting the smallest value (38) from the largest value (98).
What is the number of classes for the data set in the example?
-The number of classes is 7, as calculated using Sturges' rule with 80 data points.
How is the class width (interval) calculated for this specific example?
-The class width is calculated by dividing the range (60) by the number of classes (7), resulting in a class width of approximately 9.
How do you fill in the frequency for each class interval?
-The frequency for each class interval is determined by counting how many data points fall within each interval.
What is the total frequency for all the class intervals in the given example?
-The total frequency is 80, as the sum of the frequencies for all class intervals adds up to 80.
Outlines

This section is available to paid users only. Please upgrade to access this part.
Upgrade NowMindmap

This section is available to paid users only. Please upgrade to access this part.
Upgrade NowKeywords

This section is available to paid users only. Please upgrade to access this part.
Upgrade NowHighlights

This section is available to paid users only. Please upgrade to access this part.
Upgrade NowTranscripts

This section is available to paid users only. Please upgrade to access this part.
Upgrade NowBrowse More Related Video
Statistika Matematika Kelas X Kurikulum Merdeka

STATISTIKA PART 4 | MODUS DATA TUNGGAL & KELOMPOK

(Part 2) HISTOGRAM STATISTIKA MATEMATIKA SMA KELAS 10 KURIKULUM MERDEKA #matematikasma #bukupaket

Statistika - Ukuran Letak Data (Kuartil, Desil, Persentil)

Statistika • Part 2: Metode Pengumpulan Data dan Pengelompokan Data Tunggal

Statistika Dasar Ukuran Pemusatan Data (Mean, Modus, Median) Data Tunggal dan Data Kelompok
5.0 / 5 (0 votes)