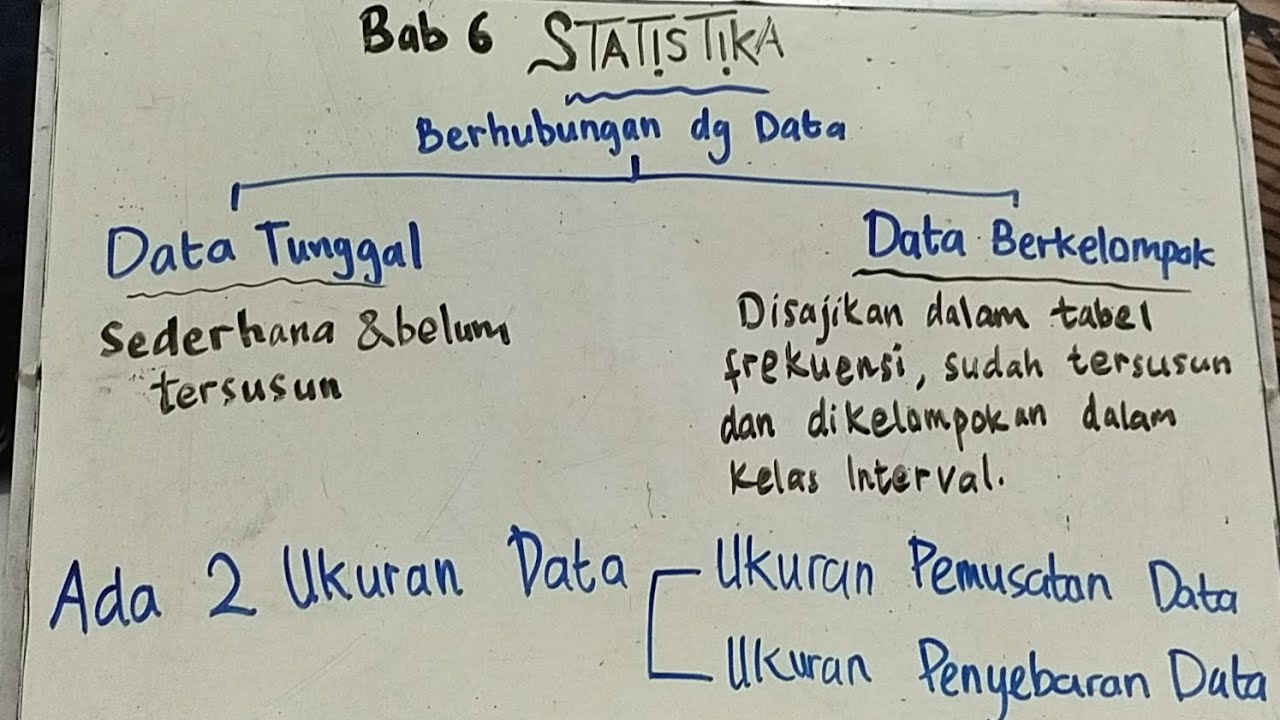
STATISTIKA PART 4 | MODUS DATA TUNGGAL & KELOMPOK
Summary
TLDRThis video explains the concept of Mode (Modus) in statistics, focusing on both single data and grouped data. For single data, the mode is the most frequent value in a dataset, with examples showing how it can be a single value, multiple values, or not exist. For grouped data, the video presents a formula for calculating the mode using the modal class and its surrounding classes. The video also includes a practical example of using the mode formula for data in a frequency table and histogram, helping viewers understand the process clearly with step-by-step instructions.
Takeaways
- 😀 The mode (modus) is the data value that appears most frequently in a dataset. It can be absent, unique, or have multiple values (bimodal or multimodal).
- 😀 For single data, if there are numbers like 3, 4, 5, 6, 6, 7, 7, the mode is 6 as it appears the most.
- 😀 In a set like 3, 4, 5, 5, 6, 6, 7, 7, the modes are 5, 6, and 7, as they all appear the same number of times.
- 😀 If all numbers in a dataset appear only once, like 22, 33, 44, 55, 66, there is no mode.
- 😀 In grouped data, the mode is found using a formula involving the lower boundary of the modal class, frequency differences (D1 and D2), and class width (P).
- 😀 The formula for grouped data is: Mode = Tbmo + (D1 / (D1 + D2)) * P.
- 😀 In an example with test scores like 60-64 (frequency 3), 65-69 (frequency 6), and 70-74 (frequency 10), the class with the highest frequency is used to find the mode.
- 😀 To calculate the mode for grouped data, first identify the modal class, then calculate D1, D2, and the class width (P).
- 😀 For example, with a modal class of 75-79, D1 is calculated by subtracting the frequency of the previous class from the modal class, and D2 is calculated similarly for the next class.
- 😀 A histogram can also be used to identify the modal class by finding the tallest bar. The mode is then calculated in the same way as with grouped data.
- 😀 Understanding the mode is crucial for interpreting both raw and grouped data, as it helps identify the most common value or range of values in a dataset.
Q & A
What is the definition of modus for single data in statistics?
-Modus for single data is the value or datum that occurs most frequently in a dataset. It may not always exist, and there can be one or more modes, depending on the frequency distribution.
How do you determine the modus of the first example with the dataset 3456, 6677?
-In the first example, the most frequently occurring value is 6, which appears twice. Therefore, the modus for this dataset is 6.
What happens if there are multiple values with the same highest frequency in a dataset?
-If there are multiple values with the same highest frequency, then all those values are considered as modes. In the second example, the modes are 5, 6, and 7, each appearing twice.
What is the modus when no value repeats in the dataset?
-When no value repeats in the dataset, there is no mode. For example, in the third dataset 22, 33, 44, 55, 66, there is no mode because all values occur only once.
What is the modus of the second example involving the weight data of students?
-The modus for the weight data is 46 kg, as it has the highest frequency, with 17 students having a weight of 46 kg.
What is the formula for finding the modus of grouped data?
-The formula for finding the modus of grouped data is: Emo = Tbmo + (D1 / (D1 + D2)) * P, where Emo is the mode, Tbmo is the lower boundary of the modal class, D1 is the difference in frequency between the modal class and the class before it, D2 is the difference in frequency between the modal class and the class after it, and P is the class width.
What is the significance of the class width (P) in the formula for grouped data?
-The class width (P) is the difference between the upper and lower boundaries of a class interval. It helps adjust the mode calculation when the data is grouped into intervals. For instance, if the class intervals are 60-64, 65-69, etc., P is the width of these intervals.
How is the mode calculated for the example involving student scores (60-64, 65-69, etc.)?
-In the example of student scores, the modal class is 75-79 because it has the highest frequency. The mode is calculated using the formula, where the lower boundary (Tbmo) of the modal class is 74.5, D1 is 4 (difference in frequency between the modal class and the previous class), D2 is 6 (difference between the modal class and the next class), and P is 5 (class width). The calculated mode is 76.5.
How do you find the mode from a histogram?
-To find the mode from a histogram, you identify the class with the highest frequency. Then, apply the same formula for grouped data to calculate the mode, using the boundaries, frequencies, and class width.
What are the steps to calculate the mode from a histogram with frequencies 15, 8, and 12 in consecutive classes?
-First, identify the modal class, which is the class with the highest frequency (15). Then, find the lower boundary of the modal class (45.5), calculate D1 and D2 (7 and 3, respectively), and determine the class width (5). Using the formula, the mode is calculated as 49.
Outlines

This section is available to paid users only. Please upgrade to access this part.
Upgrade NowMindmap

This section is available to paid users only. Please upgrade to access this part.
Upgrade NowKeywords

This section is available to paid users only. Please upgrade to access this part.
Upgrade NowHighlights

This section is available to paid users only. Please upgrade to access this part.
Upgrade NowTranscripts

This section is available to paid users only. Please upgrade to access this part.
Upgrade NowBrowse More Related Video

KULIAH STATISTIK (5) - UKURAN PEMUSATAN DATA
Statistika Matematika Kelas X Kurikulum Merdeka

Statistika Dasar Ukuran Pemusatan Data (Mean, Modus, Median) Data Tunggal dan Data Kelompok

UKURAN PEMUSATAN DATA - STATISTIKA SOSIAL

STATISTIKA BAG-1

Statistika Bagian 3 - Menghitung Modus Data Tunggal dan Data Berkelompok Matematika Wajib Kelas 12
5.0 / 5 (0 votes)