(Part 2) HISTOGRAM STATISTIKA MATEMATIKA SMA KELAS 10 KURIKULUM MERDEKA #matematikasma #bukupaket
Summary
TLDRThis video lesson focuses on teaching high school students about 'relative frequency' in statistics, particularly through histograms. The instructor explains how histograms display grouped data and how relative frequency can represent percentages within different intervals. The difference between relative and absolute frequencies is clarified, with practical examples illustrating how percentages relate to actual data counts. The video further emphasizes the importance of relative frequency for comparing datasets of different sizes and concludes with a preview of upcoming practice exercises.
Takeaways
- 😀 The video covers the topic of relative frequency in statistics, continuing from a previous video on histograms in a high school mathematics curriculum.
- 😀 Relative frequency is closely linked to percentages and can be used in histograms to represent data instead of absolute frequencies.
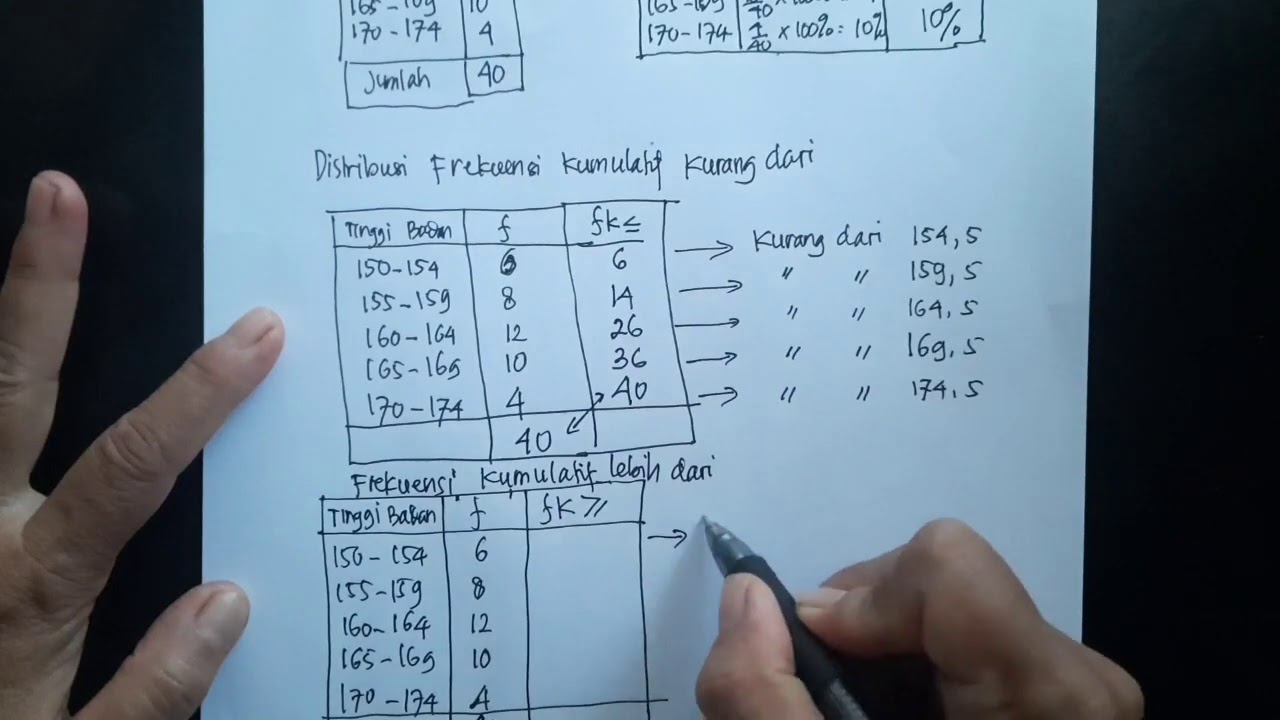
- 😀 Histograms are diagrams that display grouped data based on certain intervals or ranges, such as test scores grouped into intervals like 60-65, 65-70, etc.
- 😀 The vertical axis of a histogram showing relative frequency represents the percentage of students in each interval, while the horizontal axis shows the value ranges.
- 😀 Absolute frequency refers to the actual number of data points in each interval, such as the number of students scoring within a specific range, not percentages.
- 😀 The video demonstrates how to calculate the number of students within a certain range using relative frequency, based on the total number of students.
- 😀 The percentage of students in a given range, such as 16% in the 70-75 range, depends on the total number of students in the population.
- 😀 The relative frequency is flexible and changes with the total number of students in the population, whereas absolute frequency remains constant.
- 😀 The largest relative frequency in the example is in the interval of 80-85, with an estimated percentage of 25%.
- 😀 To calculate absolute frequency, relative frequency is multiplied by the total number of students, with percentages converted into actual numbers of students in a given range.
- 😀 The total percentage of all intervals in a relative frequency histogram will always sum to 100%, representing the entire data set or population.
Q & A
What is the main concept explained in this video?
-The main concept of this video is about understanding relative frequency in histograms, which is used to represent data as percentages, and distinguishing it from absolute frequency, which is expressed as actual counts.
What is a histogram and how is it used in this lesson?
-A histogram is a diagram that displays data grouped into intervals or classes. In this lesson, histograms are used to illustrate the distribution of test scores and show how relative frequency is calculated for each class interval.
What is the difference between relative frequency and absolute frequency?
-Relative frequency is the percentage representation of the data within each class interval, while absolute frequency is the actual count of data points in that interval.
How is relative frequency calculated using a histogram?
-Relative frequency in a histogram is calculated by taking the percentage of the total data that falls into each class interval. For example, if 16% of the students fall into a particular class interval, this represents the relative frequency.
What does the percentage on the vertical axis of a histogram represent?
-The percentage on the vertical axis of a histogram represents the relative frequency of each class interval, which shows the proportion of the total data within that interval.
Why is relative frequency useful when comparing data sets with different total numbers?
-Relative frequency is useful because it allows for the comparison of data sets with different total numbers by normalizing the data to percentages, making it easier to see the distribution patterns regardless of the total size of the groups being compared.
In the example of 100 students, how many students scored between 70-75 if the relative frequency is 16%?
-If the total number of students is 100, then the number of students who scored between 70-75 would be 16% of 100, which is 16 students.
What does the term 'frekuensi relatif' mean in the context of this lesson?
-'Frekuensi relatif' is the Indonesian term for relative frequency, which refers to the percentage representation of data in each class interval of a histogram.
How is the frequency of students scoring between 85-90 calculated if the relative frequency is 18% and there are 200 students?
-If the relative frequency for the 85-90 score range is 18%, then for 200 students, the absolute frequency would be 18% of 200, which equals 36 students.
What is the expected total percentage when adding up the relative frequencies of all the class intervals in a histogram?
-The expected total percentage when adding up all the relative frequencies in a histogram should be 100%, since all the data is accounted for within the class intervals.
Outlines

This section is available to paid users only. Please upgrade to access this part.
Upgrade NowMindmap

This section is available to paid users only. Please upgrade to access this part.
Upgrade NowKeywords

This section is available to paid users only. Please upgrade to access this part.
Upgrade NowHighlights

This section is available to paid users only. Please upgrade to access this part.
Upgrade NowTranscripts

This section is available to paid users only. Please upgrade to access this part.
Upgrade NowBrowse More Related Video

Histogram Statistika Hal 176-178 Bab 7 Statistika Kelas 10 SMA SMK Kurikulum Merdeka
Statistika 05 | Distribusi Frekuensi dalam Statistika | Frequency Distribution | Belajar Statistika

Matematika Kelas 8 Bab 6 Peluang - Frekuensi Relatif - hal. 174 - 175 - Kurikulum Merdeka
FREKUENSI RELATIF DAN FREKUENSI KUMULATIF, HISTOGRAM, DAN POLIGON

Media Pembelajaran Berbasis TIK Mata Pelajaran Fisika Karakteristik Gelombang Mekanik
Mengingat Statistik Hal 79-84 Bab 3 STATISTIK Kelas 11 SMA Kurikulum Merdeka
5.0 / 5 (0 votes)