What is Hydrogen spectrum?
Summary
TLDRThis video provides a comprehensive explanation of the hydrogen spectrum, focusing on absorption and emission spectra. It covers the Lyman, Balmer, Paschen, Brackett, and Fund series, detailing the different regions of the electromagnetic spectrum where these lines appear. The video explains how electrons in hydrogen atoms absorb energy, get excited, and emit radiation as they return to lower energy levels. It also introduces the Redberg formula to calculate the wave numbers of spectral lines. Ideal for anyone wanting to understand the basics of atomic spectra and hydrogen's unique emission lines.
Takeaways
- 😀 Hydrogen spectrum consists of both absorption and emission spectra.
- 😀 Absorption spectra occur when radiation passes through a sample and absorbs specific wavelengths, leaving dark spaces in the spectrum.
- 😀 Emission spectra are produced when atoms or molecules absorb energy, get excited, and then emit radiation to return to their stable state.
- 😀 Hydrogen's line emission spectra consists of various lines in different regions of the electromagnetic spectrum: UV, visible, and infrared.
- 😀 The Lyman series is observed in the UV region when electrons return to the first energy level (n=1).
- 😀 The Balmer series appears in the visible region when electrons return to the second energy level (n=2).
- 😀 The Paschen, Brackett, and Fund series are found in the infrared region, with electrons returning to the third, fourth, and fifth energy levels, respectively.
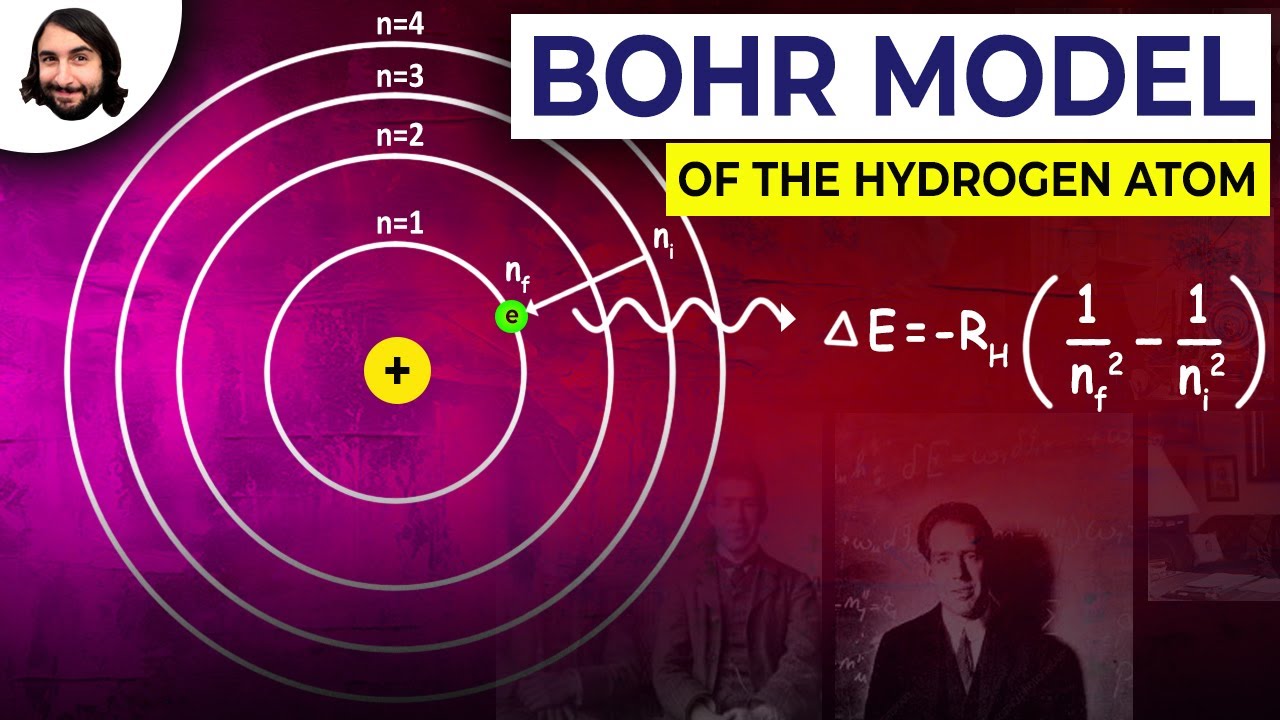
- 😀 The spectral lines of hydrogen can be calculated using the Rydberg formula, which relates the wave number to the energy levels involved.
- 😀 The value of n1 in the Rydberg formula represents the lower energy level, while n2 represents the higher energy level.
- 😀 The frequency of spectral lines decreases and wavelength increases as the distance between energy levels decreases from Lyman to Fund series.
- 😀 The emission spectrum of hydrogen can be used to study atomic transitions and the energy released when electrons move between energy levels.
Please replace the link and try again.
Outlines

This section is available to paid users only. Please upgrade to access this part.
Upgrade NowMindmap

This section is available to paid users only. Please upgrade to access this part.
Upgrade NowKeywords

This section is available to paid users only. Please upgrade to access this part.
Upgrade NowHighlights

This section is available to paid users only. Please upgrade to access this part.
Upgrade NowTranscripts

This section is available to paid users only. Please upgrade to access this part.
Upgrade NowBrowse More Related Video


5.0 / 5 (0 votes)