How to find where your users are coming from using Acquisition Reports in Google Analytics 4
Summary
TLDRIn this educational video, Krista Seiden guides viewers through Google Analytics' acquisition reports, which reveal the sources of website traffic and user engagement. She introduces key metrics like users, new users, and sessions, and explains dimensions such as campaign, source, medium, and channel. The video demonstrates how to interpret these metrics to understand user acquisition and session initiation, and how to leverage this data to optimize marketing strategies. It also highlights the importance of analyzing both new and returning user data to inform business decisions.
Takeaways
- π Krista Seiden introduces acquisition reports in Google Analytics, which help understand user traffic sources.
- π₯ This is the second video in a series focusing on Google Analytics reporting for user interaction insights.
- πΊ Viewers are encouraged to access the analytics demo account for a practical walkthrough using the Google Merchandise store as an example.
- π Acquisition reports provide an overview with cards displaying high-level information about user traffic.
- π₯ Key metrics defined include 'Users', 'New Users', and 'Sessions', which are crucial for measuring website or app interaction.
- π 'Campaign', 'Source', 'Medium', and 'Channel' are key dimensions for analyzing traffic, each with specific meanings for marketing analysis.
- π The acquisition overview card can be interacted with to view data by different dimensions like source, medium, or channel.
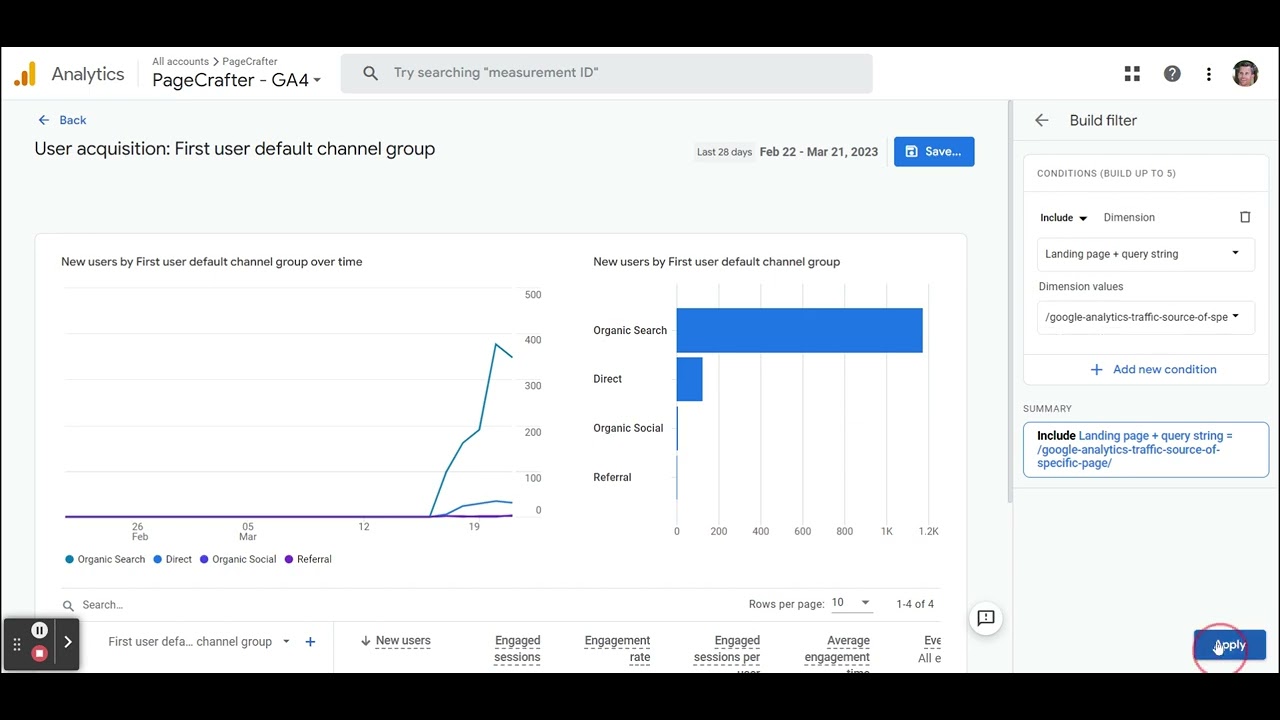
- π The user acquisition report focuses on the initial touchpoints of new users, while the traffic acquisition report looks at session initiations.
- π° The script demonstrates how to analyze which traffic sources are most valuable by looking at purchases and revenue.
- π Adding a secondary dimension like 'first user source medium' helps understand the user journey from initial discovery to return visits.
Q & A
What is the purpose of the acquisition reports in Google Analytics?
-The acquisition reports help you understand where your users and traffic are coming from, and how they are finding or returning to your website or app.
What is the difference between 'users' and 'new users' in Google Analytics?
-'Users' refers to the total number of visitors to your site or app, while 'new users' is a subset representing those who visited your site or app for the first time within the selected date range.
How does Google Analytics define a 'session'?
-A session is a group of user interactions within a given time frame. It begins when a user opens your site or app and ends when they leave or are inactive for at least 30 minutes.
What is the difference between 'user acquisition' and 'traffic acquisition' reports?
-'User acquisition' reports focus on the first campaign source and medium that brought the user, while 'traffic acquisition' reports focus on the session source medium and campaign that initiated a session.
How can you use acquisition reports to determine the effectiveness of marketing campaigns?
-By analyzing the dimensions such as campaign, source, and medium, you can see which marketing efforts are driving the most new users or sessions and identify which sources bring the most value or revenue.
What are some common traffic sources and mediums you can track in Google Analytics?
-Common traffic sources include search engines like Google, social media platforms, direct links, and referrals from other websites. Mediums include organic, CPC (paid ads), email, and referral traffic.
How can you track the effectiveness of Google Ads campaigns in acquisition reports?
-By linking Google Ads to Google Analytics, you can see specific metrics related to Google Ads, such as sessions, clicks, cost, and cost per click, and analyze campaign performance through the acquisition reports.
What is the significance of the 'source/medium' dimension?
-The 'source/medium' dimension combines the source and medium to provide more detailed insights into where traffic originates, such as distinguishing between Google Organic traffic and Google CPC (paid ads) traffic.
How can the traffic acquisition report help you optimize your marketing budget?
-By analyzing which traffic sources and mediums drive the most purchases and revenue, you can identify where to allocate your marketing dollars more effectively to maximize returns.
What is the purpose of adding a secondary dimension in acquisition reports?
-Adding a secondary dimension, such as 'first user source/medium,' allows you to analyze how users first found your site and how they returned, providing deeper insights into user behavior and the customer journey.
Outlines
π Introduction to Acquisition Reports in Google Analytics
Krista Seiden introduces viewers to acquisition reports in Google Analytics, emphasizing their utility for understanding user traffic sources. She mentions that this video is part of a series on Google Analytics reporting, designed to answer basic questions about user engagement. Krista encourages viewers to access the analytics demo account for a practical walkthrough using the Google Merchandise store as an example. She navigates through the demo account, explaining the acquisition reports' overview and introducing key metrics such as users, new users, and sessions. She also defines important dimensions like campaign, source, medium, and channel, which are crucial for analyzing traffic data.
π Deep Dive into User and Traffic Acquisition Reports
This section delves deeper into the specifics of user acquisition and traffic acquisition reports. Krista explains the difference between the two, with the user acquisition report focusing on the initial touchpoints of new users and the traffic acquisition report examining the session initiation points for all users. She demonstrates how to interact with the reports, change dimensions, and explore data like Google Ads campaigns. Krista also shows how to analyze the effectiveness of marketing efforts by looking at the source of new users and sessions. Additionally, she discusses how to assess the value of different traffic sources by examining metrics related to purchases and revenue.
π Understanding User Journey and Marketing Impact
In the final paragraph, Krista demonstrates how to combine dimensions to understand the user journey, from initial discovery to subsequent visits. She shows how to add a secondary dimension to the reports to view both the first user source medium and the session source medium, providing insights into how users find the website and how they return. Krista wraps up the lesson by summarizing the key learnings and encourages viewers to join the next video in the series, which will cover website performance and demographic reporting. She signs off with a reminder to enjoy the measurement process.
Mindmap
Keywords
π‘Acquisition Reports
π‘Google Analytics
π‘Users and New Users
π‘Sessions
π‘Campaign
π‘Source
π‘Medium
π‘Channel
π‘User Acquisition Report
π‘Traffic Acquisition Report
π‘Google Merchandise Store
Highlights
Introduction to acquisition reports in Google Analytics for understanding user traffic sources.
The video is part of a series on reporting in Google Analytics.
Access to a demo account for following along with the tutorial.
Overview of the Google Merchandise store as a real online store example.
Explanation of the acquisition reports and their role in analyzing user traffic.
Introduction to key metrics like users, new users, and sessions in Google Analytics.
Definition of 'campaign' in the context of Google Analytics.
Clarification of 'source' and its significance in tracking user traffic.
Description of 'medium' as a category of traffic sources.
Explanation of 'channel' as a rule-based grouping of traffic sources.
How to interact with acquisition overview cards to view different dimensions.
Details on Google Ads campaigns and their integration with Google Analytics.
Difference between user acquisition and traffic acquisition reports.
Analyzing where new users are coming from using the user acquisition report.
Understanding how sessions start on the website using the traffic acquisition report.
Identifying valuable traffic sources for driving purchases and revenue.
Combining dimensions to analyze user journey from first visit to return visits.
Conclusion andι’ε of the next video on website performance and demographic reporting.
Transcripts
- Hi, I'm Krista Seiden.
In this video, I'm gonna walk you
through the acquisition reports in Google Analytics.
- You can use these reports to understand
where your users and your traffic are coming from
and how they're finding or returning to your website or app.
Two quick things before we get started.
This video is the second video in a video series all about
reporting and Google Analytics.
Together we're looking at how to find answers
to your basic questions about how people are finding
and interacting with your website or your app.
Find all the related videos on the Google
Analytics YouTube channel.
Second, if you haven't already,
you can access the analytics demo account
to follow along with me today.
I'll be showing you reports from a real Google Analytics
account for the Google Merchandise store,
and you can get access to view that property
through the link in this video's description.
If you use the demo account, you can follow along with me,
or if you'd prefer, you can also look at the same reports in
your own Google Analytics property.
With that, let's dive in to Google Analytics.
Here we are in a demo account
for the Google Merchandise store.
The Google Merchandise store is a real online store
where you can buy Google branded gear.
Today we'll look at the acquisition reports to see
how users are coming to the website.
So when we first open the property,
we're here on the homepage.
I'm gonna go to the navigation menu and open reports,
and then I'll click on acquisition and overview.
This is just that, an overview with cards
that show you high level information about
how users are coming to your website.
You'll see things like users and new users, real time
and many more cards that get into specific details
that you can dive into about how users are arriving.
But before we start looking at these cards and reports,
it helps to know a few terms
that you'll see in the UI.
Here are a few metrics that quantify your traffic.
A user is a person who interacts with your website
or app whose activity you're measuring.
So users represent the total number of visitors
to your site or app.
New users is a subset of your users,
specifically those users who visited your site
or app for the first time within the selected date range.
Session, groups of users interactions together in a given timeframe.
Think of a session as a single time period of interaction
with your site or app.
A session begins when they open your app
or view a page on your website
and ends when they exit your website or app
or when they've been inactive for at least 30 minutes.
During that one session, they might visit multiple pages
or screens, trigger multiple events
or make one or more purchases.
So back in the acquisition overview, there are a bunch
of cards with data that reference these metrics.
In these cards, we see new user
and session counts grouped by some dimensions
that help you understand where those users came from
or from where the session was initiated.
That is did they come from a search, a direct link,
a social media app, or website, an online ad and so on.
So let's define these dimensions as well
and then we'll dive deeper into the reports.
Campaign refers literally to either a paid promotion
or marketing campaign.
This could be a Google Ads campaign
or a custom campaign that you've created.
For example, a paid ad campaign might have the name
of holiday sale 2023
or a custom campaign might have the name of blog post 2023.
To get the most accurate campaign data from Google Ads products,
you'll need to set up product links with Google Ads.
Source, is either the website from which your
user came to your website
or a custom name for the user clicked from.
For example, you might see Google here for users who came
to your site from Google search,
and you might also see various social media sites
that referred users to your website.
You could also see popular blogs that link to your website
or custom name when coming from something like an email.
If a user came to your website
by typing your URL directly into their browser,
or they had bookmarked your site
and came to it that way,
youβll see direct as the website traffic source.
A medium represents a group
of traffic sources, grouped by category.
So for example, you'll see things like organic
that aggregate traffic from search engines,
email for email provider sources, CPC for paid ads,
meaning cost per click,
and referral for users
who clicked from a link on a different website.
Some of these are automatically defined by analytics
and for others, you also have the option to create your own.
You'll often see these combined
as one dimension, source medium.
This can help you get more information out of the source.
For example, you might see Google Organic
and Google CPC, which helps you distinguish
between organic search on Google and your paid search ads.
Finally, a channel is a rule-based grouping of sources,
mediums, or other rules to separate traffic,
to help you figure out at a high level which groupings drive
the most traffic or value for your business.
There are default channel groupings,
which will show up automatically,
and you can also create your own channel groupings
where you define the rules
to break your data down in other ways.
So in the acquisition reports,
we're gonna see these dimensions, campaign source, medium
and channel to learn how new users come to visit
for the first time, and also
how individual sessions started across all users.
So let's look back at the acquisition overview,
and we can see that the default dimension in this first card
is the default channel group.
We're looking at new users
by first user default channel group.
Now we can interact with these cards
and change this to source, medium,
or source medium if we'd like to see new users
by that dimension.
Same thing in the next card sessions
by session default channel group,
but we can update that to be session medium if we'd prefer.
This next card is Sessions by session Google Ads campaign.
Now if we click into this card, view Google Ads campaigns,
this will actually take us to a whole report specifically
for our Google Ads campaign information.
Now, this is available when we've linked Google Ads
to Google Analytics and then gives us insight into
how our campaigns are performing.
So you can see here we have session Google Ads campaigns
across users sessions, engaged sessions, Google Ads clicks,
Google Ads costs, and Google Ads cost per click.
You can also change this primary dimension here from Google
Ads campaign to any other number of dimensions
that are available from this integration.
After the overview report, we have the user acquisition
and the traffic acquisition report.
Now let's take a moment to understand the differences here.
The user acquisition report is gonna look at the very first
campaign source and medium that we see from that user,
whereas the traffic acquisition report will look at the
session source medium and campaign.
You can use these reports to answer questions such as,
where are my new users coming from?
For that one, we'd specifically look at the
user acquisition report.
This defaults to new users
by first user default channel group over time.
But again, we can change this and interact with it,
and if we'd prefer to see this by first user source medium,
we can do that here.
Now in this case, it looks like a lot of the users
to the Google Merchandise store are coming directly.
So either they bookmark that link or they typed it in,
or we see we have a lot of traffic coming from Google CPC,
which is Google Search and Google Organic traffic.
This can also help answer the question of which
of my marketing efforts are driving the most new users
to my site here in this user acquisition report.
So in terms of marketing efforts, it looks like you know,
Google paid search is definitely driving several new users
to our site, but there are other efforts such
as traffic coming from the support pages for Google,
and if we expand this,
we'll see many more
sources and mediums that are driving traffic such as
partners and affiliates and Google Groups.
Now that we have a good idea of how new users are coming
to our site, let's look at the traffic acquisition report
to understand how sessions are starting on our site.
This report will default
to the session default channel group again.
So I can see mostly most
of my sessions come from direct traffic
and then organic search,
but I can change this just like in the user acquisition report
to Session Source Medium
if I'd like to get more insight.
So now I can see that most of my sessions still are driven
by direct traffic, but in this case,
it looks like Google Organic traffic
is sending more individual sessions than Google CPC,
where we saw those flipped in the previous report.
I also see, scrolling down here to the bottom
that we're getting a decent amount
of traffic coming from our latest newsletter, which is great
to see that level of detail here.
I can use this information to let my email team know
that their marketing efforts have been successful.
Now, one important question
that you might be asking yourself is,
which traffic sources are bringing in the most
value for my business?
What is driving purchases?
What is driving revenue for my business?
So here in this traffic acquisition report,
we're looking at Source medium,
and if I scroll over in this table,
I can change this event count metric to just look
for the purchase event.
And when I do so, I will now see
how many purchases are driven by each source medium.
Looks like direct is definitely driving a lot
of purchases, but I can sort this by this column,
if I just click this little downward arrow
and it puts it in order
of which source mediums are driving those purchases.
So we still have direct, but it looks like
Google Organic is our second,
Google CPC is down at four,
and then we're getting some referrals, driving purchases beyond that.
I can also, if I'd like, sort this
by total revenue, by scrolling over
and clicking on the last column,
this doesn't change the order too much,
but now I can see the total revenue driven by each
of these source medium combinations,
and this will help me to determine my future marketing
efforts and where I might want
to spend my marketing dollars.
Now the last thing that I wanna show you is
how we can actually combine these two dimensions to look at
how people first find your website
and then how they come back.
So I'm gonna scroll back over here and focus on users.
And now I'm gonna go ahead and add what's called
a secondary dimension.
So I'm gonna click this plus icon
and I'm gonna add the first user source medium.
Now what we see here is the second column is
our first user source medium.
So this is how people first found our site,
and the first column is our session source
medium, how people came back.
So they first found it from direct
and they came back to direct,
or they found it from a Google ad on Google search
and came back in the same way or through Google Organic.
This is a great way to understand the user journey,
how people are finding you and how they're coming back.
And then again, you can look at this across the many
dimensions that we've talked about such as purchases
and revenue to understand the
impact of these different channels.
With that, we'll wrap up this lesson.
Now you know a few different ways to see
where your new users and sessions are coming from.
Join us back here tomorrow for the next video in the series,
all about website performance and demographic reporting.
All videos in this series will be linked in the description
below the video, so we'll see you for the next one.
In the meantime, happy measuring.
Browse More Related Video
1.1 Learn about your business with digital analytics - New for GA4 Analytics Academy on Skillshop
Google Analytics 4 (GA4) 2024 For Beginners - Everything You NEED To KNOW!
New Google Analytics 4 Manual Campaign Dimensions & Report
What is web analytics?
What is Mixpanel: Product Demo
Introduction to Google Analytics - Bryan Phelps
5.0 / 5 (0 votes)