Slope Analysis using ArcGIS Pro | With DEM Data
Summary
TLDRIn this video tutorial, the presenter demonstrates how to create a slope map from a Digital Elevation Model (DEM) using ArcGIS Pro. The process involves adding DEM data, navigating to the appropriate tools, and selecting the slope function to generate a slope map. The tutorial explains the difference between slope measurements in degrees and percentage rise, discussing their uses in terrain analysis and engineering. Additionally, viewers are shown how to adjust color schemes and classifications to interpret the map effectively, highlighting areas of high and low slopes for better understanding.
Takeaways
- 😀 To create a slope map from a Digital Elevation Model (DEM) in ArcGIS Pro, start by adding the DEM data to the map using the 'Add Data' option.
- 😀 The DEM data used in this tutorial is SRTM DEM data with a 30-meter resolution, which can be downloaded from the USGS Earth Explorer website.
- 😀 After adding the DEM, open the 'Geoprocessing' toolbox and navigate to 'Spatial Analysis Tools' to access the 'Surface' tools, including the 'Slope' tool.
- 😀 The 'Slope' tool in ArcGIS Pro generates a slope map by calculating the slope of the terrain based on the input DEM.
- 😀 When using the 'Slope' tool, the input DEM is selected, and an output location for the slope map file is specified, typically as a .tiff file.
- 😀 Slope measurements in ArcGIS Pro can be represented in two units: degrees and percentage rise. The degree represents the angular slope, while percentage rise shows vertical change relative to horizontal distance.
- 😀 The 'degree' measurement represents slope in angular units, with 0° representing flat terrain and 90° representing a vertical slope.
- 😀 The 'percentage rise' measurement expresses the ratio of vertical rise to horizontal distance, with higher percentages indicating steeper slopes.
- 😀 The choice between degree and percentage rise depends on the application; degrees are commonly used for terrain analysis and cartography, while percentage rise is more intuitive for engineering and land management.
- 😀 After generating the slope map, the symbology can be adjusted to classify the slope into different categories, such as using the 'Natural Breaks' method for classification and adjusting the number of classes.
- 😀 The slope map can be visually enhanced by changing the color ramp, making it easier to distinguish areas with steep slopes (e.g., red) from flat areas (e.g., green or brown).
Q & A
What is the purpose of the video?
-The video demonstrates how to create a slope map from a Digital Elevation Model (DEM) in ArcGIS Pro.
Where can you find the DEM data used in the video?
-The DEM data used in the video is sourced from the USGS Earth Explorer website, and the link to access it is provided in the description.
What is the first step in creating a slope map in ArcGIS Pro?
-The first step is to add the DEM data into ArcGIS Pro by clicking on the 'Add Data' option in the 'Map' tab.
How do you access the tool needed to create a slope map in ArcGIS Pro?
-To access the tool, you navigate to the 'Analysis' tab, then click on 'Tools,' and finally, under 'Toolboxes,' you find the 'Spatial Analysis Tools' and then the 'Surface' tool.
What is the purpose of the 'Slope' tool in ArcGIS Pro?
-The 'Slope' tool calculates the slope map based on the input DEM data, which helps to visualize the terrain's steepness.
What are the two output measurement options for slope analysis?
-The two output measurement options for slope analysis are 'Degree' and 'Percentage Rise'.
What is the difference between 'Degree' and 'Percentage Rise' in slope measurements?
-'Degree' represents the slope in angular units (0° to 90°), showing the slope's incline, while 'Percentage Rise' represents the vertical rise over horizontal distance, providing a more intuitive, practical measure for construction and land management.
What is the significance of the Z Factor in the slope analysis?
-The Z Factor is used to adjust the vertical unit of measurement to match the horizontal units. It is often adjusted based on the location of the DEM data.
How do you customize the appearance of the slope map in ArcGIS Pro?
-You can customize the slope map's appearance by right-clicking the 'Slope' layer, selecting 'Symbology,' and adjusting the classification method, number of classes, and color ramp.
What does the color red represent on the slope map?
-The red color on the slope map represents areas with the highest slope values, indicating steep terrain.
What information can be derived from the slope map's visualization?
-The slope map allows users to identify regions with steep terrain (in red) and flat terrain (in dark green), with a clear distinction between the southern and northern parts of the map based on elevation and steepness.
Outlines

Этот раздел доступен только подписчикам платных тарифов. Пожалуйста, перейдите на платный тариф для доступа.
Перейти на платный тарифMindmap

Этот раздел доступен только подписчикам платных тарифов. Пожалуйста, перейдите на платный тариф для доступа.
Перейти на платный тарифKeywords

Этот раздел доступен только подписчикам платных тарифов. Пожалуйста, перейдите на платный тариф для доступа.
Перейти на платный тарифHighlights

Этот раздел доступен только подписчикам платных тарифов. Пожалуйста, перейдите на платный тариф для доступа.
Перейти на платный тарифTranscripts

Этот раздел доступен только подписчикам платных тарифов. Пожалуйста, перейдите на платный тариф для доступа.
Перейти на платный тарифПосмотреть больше похожих видео
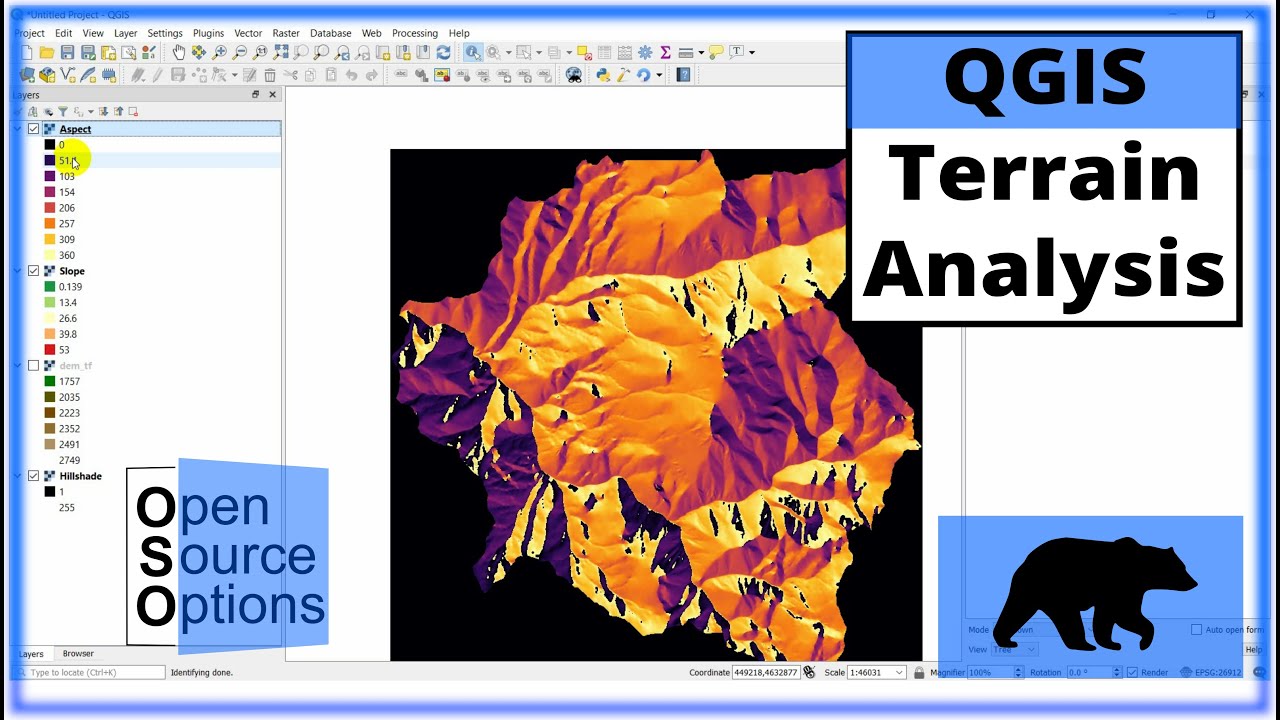
QGIS Terrain Analysis: hillshade, slope, aspect (Version 3.x)
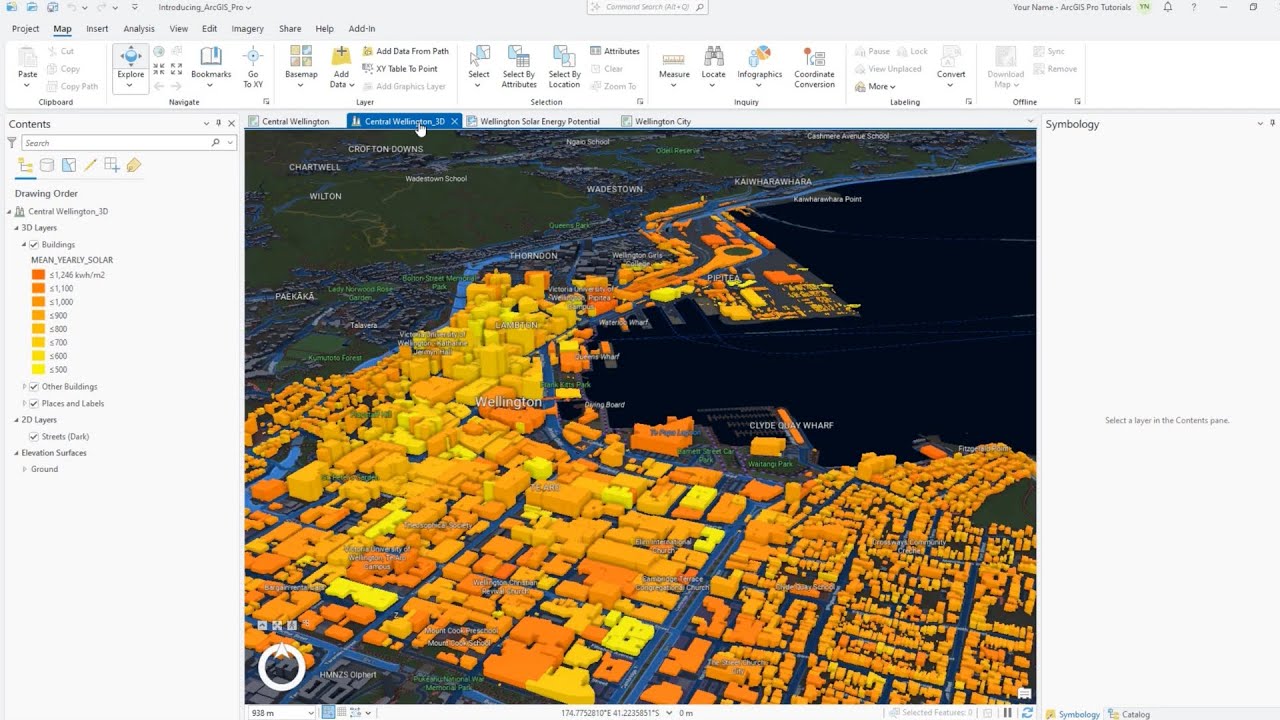
Introducing ArcGIS Pro

Praktikum Sistem Informasi Geografi - Pembuatan Peta Kemiringan Lereng Demnas
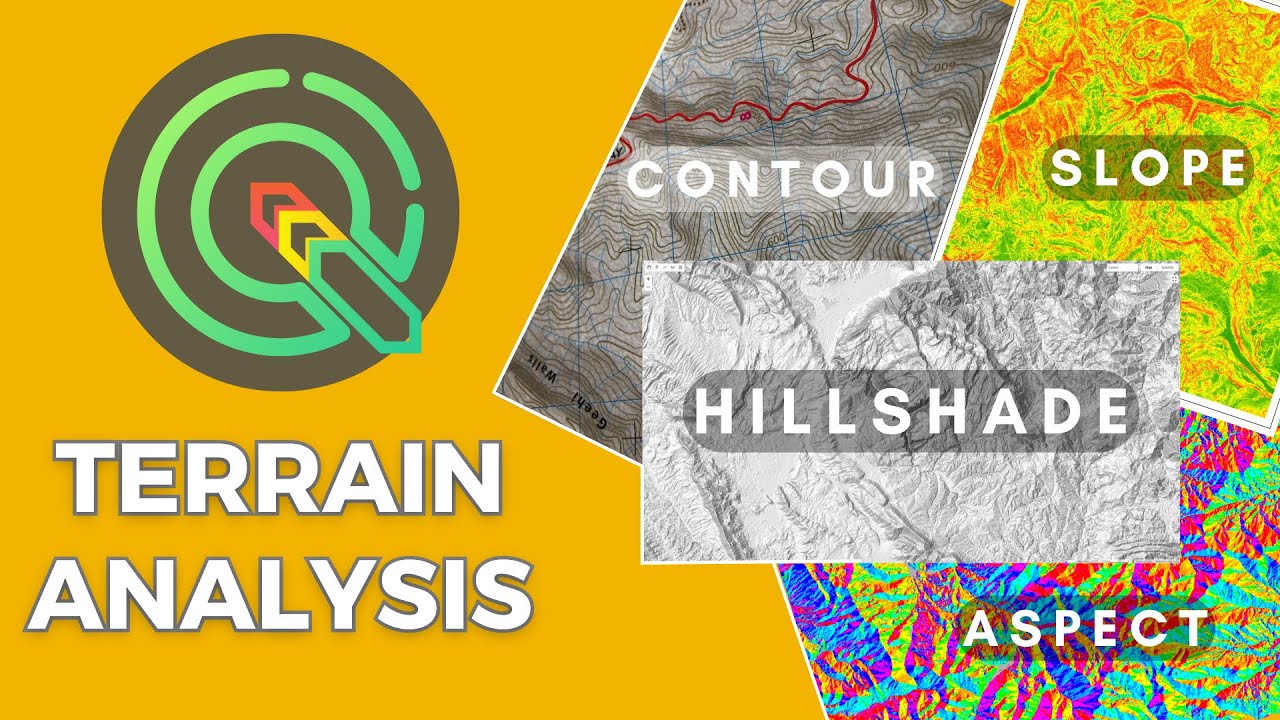
QGIS Terrain Analysis (Slope, Aspect, Hillshade, contour lines)
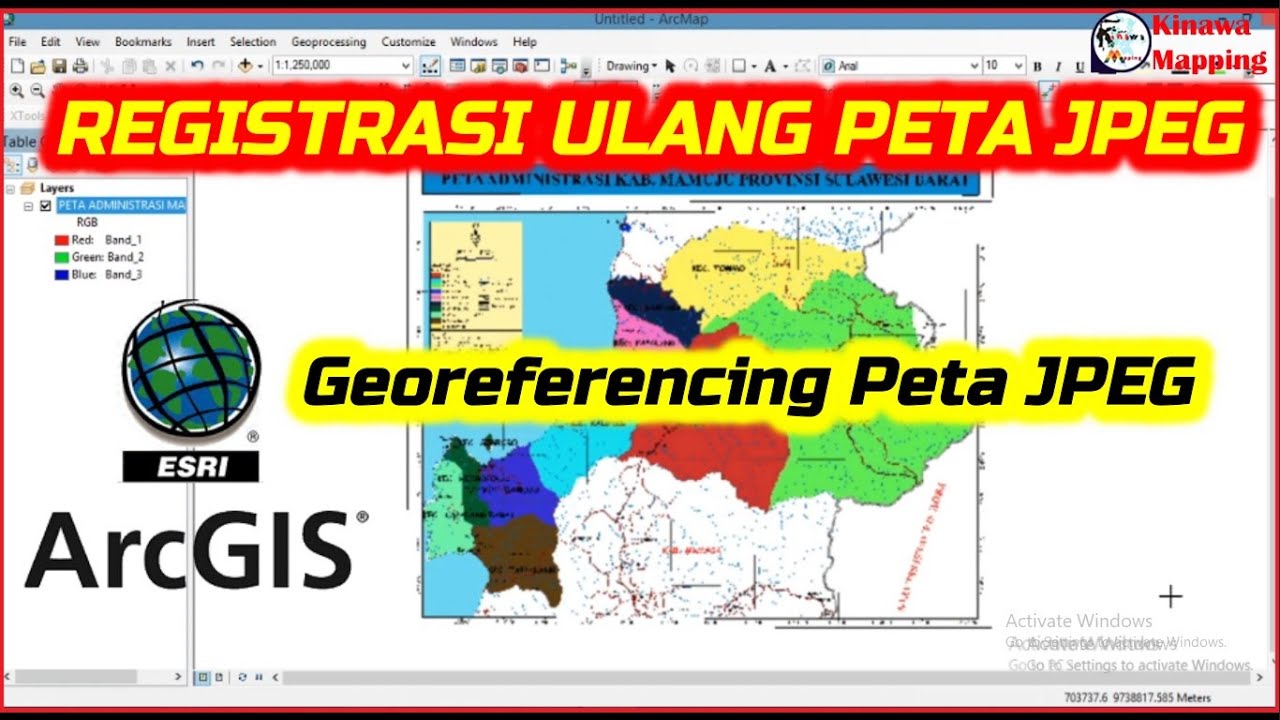
Registrasi Ulang Peta JPEG di ArcGis

TUTORIAL ATTACHMENT FOTO ARCGIS - mapvel geospatial
5.0 / 5 (0 votes)
