QGIS Terrain Analysis (Slope, Aspect, Hillshade, contour lines)

RS & GIS
13 Aug 202307:55

Summary

TLDRThe video script explains how to use an algorithm to calculate the angle of inclination from a raster layer, expressed in degrees. It details importing a DEM layer, using the slope command for analysis, customizing the output appearance, and generating an aspect map indicating the slope's compass direction. The script also covers creating a hillshade effect for terrain visualization, adjusting sun azimuth, and extracting contour lines from a DEM layer to show elevation changes. It emphasizes the importance of selecting proper parameters and demonstrates how different settings affect the output.

Takeaways

  • πŸ“ The algorithm calculates the angle of inclination of terrain from an input raster layer, expressing the slope in degrees.
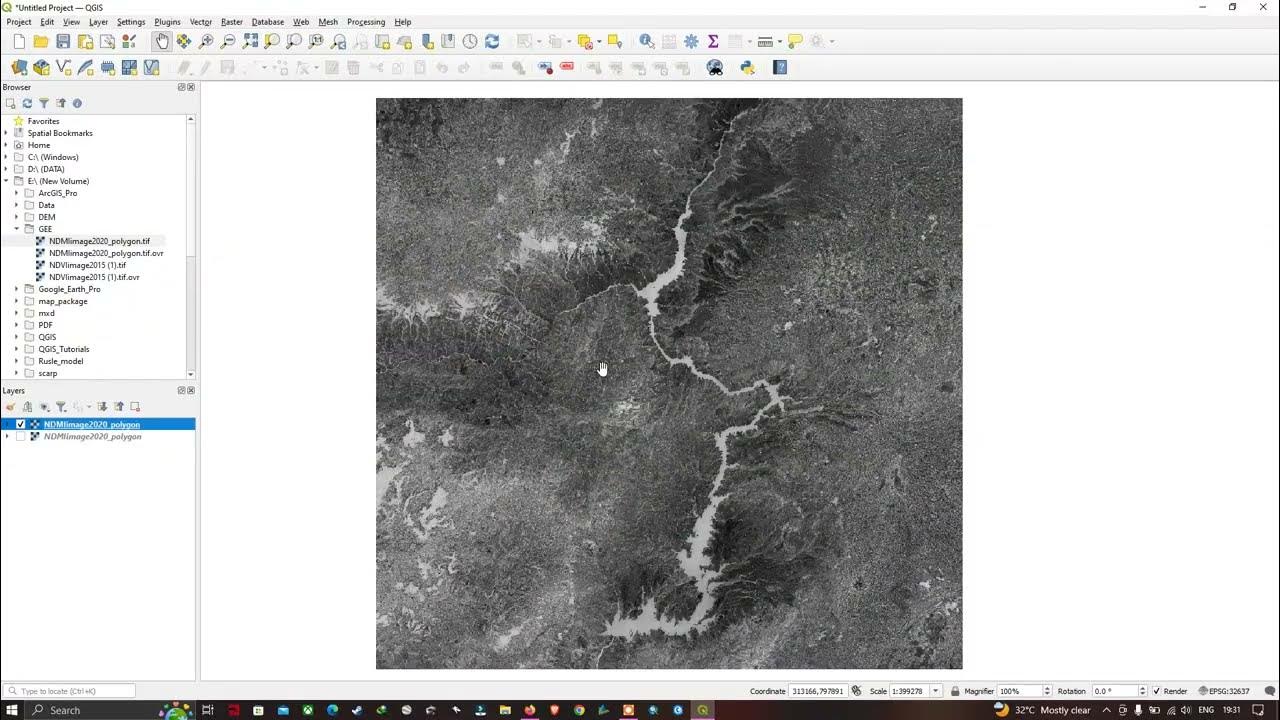
  • 🌍 To apply the slope, you need a DEM (Digital Elevation Model) layer imported into the software using the data source management tool.
  • πŸ–ΌοΈ Go to the raster section, select your layer from the requested path, and click add to enter the software.
  • πŸ› οΈ In the raster section, select the slope command from the analysis section and enter your layer to see the final output.
  • 🎨 Customize the appearance by going to the layer properties section, selecting render type from the symbology section, setting it on platted, and choosing a color combination.
  • πŸ“ The aspect command generates an aspect map from any supported elevation raster, showing the compass direction a slope faces.
  • 🧭 To perform the aspect command, go to the raster section, select the aspect command from the analysis section, select the desired layer, and set an output path.
  • πŸŒ„ Hill shade outputs a raster with a shaded relief effect, useful for visualizing terrain, allowing adjustments for azimuth and altitude of the light source.
  • πŸ”„ To apply the hill shade command, select the hill shade option from the raster and analysis section, enter the desired layer, and optionally change some parameters.
  • πŸ—ΊοΈ Contour lines indicate ground elevation or depression on a topographic map, with intervals set to specify the distance between lines, providing insights into elevation changes.

Q & A

  • What does the algorithm calculate from the input raster layer?

    -The algorithm calculates the angle of inclination of the terrain from the input raster layer, with the slope expressed in degrees.

  • What is required to apply the slope command?

    -A Digital Elevation Model (DEM) is required to apply the slope command.

  • How do you import a DEM layer into the software?

    -To import a DEM layer, use the Data Source Management tool, go to the raster section, select the layer from the requested path, and click add.

  • How do you customize the appearance of the slope output?

    -To customize the appearance, go to the layer properties section, select render type from the symbology section, set it on platted, and choose a color combination.

  • What does the aspect command generate?

    -The aspect command generates an aspect map from any supported elevation raster, indicating the compass direction that a slope faces.

  • How is the aspect measured and what does it represent?

    -The aspect is measured in degrees from 0 to 360 degrees from North, indicating the azimuth, or compass direction, that a slope faces.

  • What is the purpose of the hill shade command?

    -The hill shade command outputs a raster with a shaded relief effect, useful for visualizing terrain, and allows specifying azimuth, altitude of the light source, vertical exaggeration factor, and scaling factor.

  • What input is necessary for the hill shade command?

    -The input for the hill shade command must be a DEM layer.

  • What is a contour line and its interval?

    -A contour line is drawn on a topographic map to indicate ground elevation or depression, and a contour interval is the vertical distance or difference in elevation between contour lines.

  • How do you extract contour lines and set the interval?

    -To extract contour lines, go to the raster section, select the Contour option from the extraction section, input the DEM layer, and specify the distance between contour lines, such as setting it to 10 meters.

Outlines

00:00

πŸ“ Slope Calculation and Customization

This paragraph explains the process of calculating the slope of terrain from an input raster layer, which is expressed in degrees. The slope is calculated using a Digital Elevation Model (DEM), which is imported into the software. The user navigates through the software's data source management tool to add the DEM layer to the raster section. The slope command is then selected from the analysis section, and the input layer is specified. The final output is the slope command output, which can be customized in terms of appearance by selecting a render type and color combination. The aspect command generates an aspect map, which shows the compass direction a slope faces, and can be adjusted for visualizing terrain. The hill shade command is also mentioned, which outputs a raster with a shaded relief effect, allowing users to specify the light source's azimuth, altitude, and scaling factor for better visual representation.

05:08

🌑️ Contour Lines Extraction and Interpretation

The second paragraph delves into the process of extracting contour lines from a DEM layer, which are used to indicate ground elevation or depression. Contour intervals, the vertical distance between contour lines, are crucial for understanding terrain changes. The user selects the Contour option from the extraction section, specifying the DEM layer as the input. The distance between contour lines can be set, with the example of creating contour lines every 10 meters or 80 meters. The color of the contour lines can be adjusted to highlight areas with extreme elevation changes or areas with lower density. This process provides a visual representation of the terrain's elevation, aiding in the interpretation of the landscape.

Mindmap

Keywords

πŸ’‘DEM

A Digital Elevation Model (DEM) is a 3D representation of a terrain's surface created from terrain elevation data. In the video, DEM layers are essential inputs for various analyses such as calculating slope, aspect, and hill shade, illustrating the fundamental role of DEM in terrain analysis.

πŸ’‘Slope

Slope measures the steepness or degree of incline of a terrain. It is expressed in degrees. The video explains how to calculate the slope from a DEM layer using the software's analysis tools, highlighting its importance in understanding terrain features.

πŸ’‘Aspect

Aspect refers to the compass direction that a slope faces, measured in degrees from north. The video demonstrates how to generate an aspect map from a DEM layer, showing the directional orientation of the terrain which is crucial for various environmental and geological studies.

πŸ’‘Hill Shade

Hill shade is a technique that creates a shaded relief effect on a raster to visualize terrain. It uses parameters like azimuth and altitude of the light source. The video shows how to apply this to a DEM layer, enhancing the visual representation of terrain elevations.

πŸ’‘Contour Line

Contour lines are used on maps to represent elevations. Each line connects points of equal elevation. The video explains how to extract contour lines from a DEM layer, with the interval between lines indicating the vertical distance between elevations, useful for understanding topography.

πŸ’‘Azimuth

Azimuth in this context refers to the angle between the north direction and the projection of the sun's rays onto the horizon. It is crucial for hill shade analysis as changing the azimuth alters the angle of sunlight, impacting how terrain features are illuminated and shaded.

πŸ’‘Symbology

Symbology in GIS refers to the visual representation of map data. The video shows how to customize the appearance of the slope output by adjusting the render type and color combinations, which helps in making the data more interpretable and visually appealing.

πŸ’‘Raster

Raster data is a grid of pixels or cells, each with a value representing information such as elevation. The video frequently mentions the raster section and raster layers, underscoring their importance in digital terrain analysis and the creation of visual outputs like slope and aspect maps.

πŸ’‘Analysis Section

The analysis section of the software contains tools for performing various terrain analyses. The video guides the user through this section to apply commands like slope, aspect, and hill shade, emphasizing its role in executing geospatial calculations and generating outputs.

πŸ’‘Contour Interval

The contour interval is the vertical distance or difference in elevation between contour lines. The video demonstrates setting different contour intervals (e.g., 10 meters, 80 meters) to show how changing this parameter affects the density of contour lines and the detail of the topographic map.

Highlights

Algorithm calculates terrain inclination angle from raster layer input.

Slope expressed in degrees and requires a DEM for application.

Import DEM layer using data source management tool.

Navigate to raster section to select and add the layer.

Use slope command in analysis section for terrain analysis.

Customize appearance by adjusting layer properties and render type.

Aspect command generates a map of slope compass directions.

Aspect values range from 0 to 360 degrees, indicating azimuth from North.

Hill shade effect visualizes terrain with shaded relief.

Adjustable parameters for light source, vertical exaggeration, and scaling in hill shade.

Contour lines indicate ground elevation on topographic maps.

Contour interval defines the vertical distance between lines.

Extract contour lines using the Contour option from the extraction section.

Specify distance between contour lines for elevation analysis.

High density of contour lines indicates more extreme elevation changes.

Lower density contour lines suggest less change in altitude.

Adjust contour line distance for clearer elevation changes.

Transcripts

play00:00

foreign

play00:14

this algorithm calculates the angle of

play00:16

inclination of the terrain from an input

play00:18

raster layer the slope is expressed in

play00:21

degrees

play00:22

to apply the slope you'll need a Dem so

play00:26

we import a Dem layer into the software

play00:30

for this purpose use the data source

play00:32

management tool go to the raster section

play00:35

select your layer from the requested

play00:37

path

play00:38

and click add to enter the software

play00:44

go to the raster section

play00:47

select the slope command from the

play00:49

analysis section

play00:54

enter your layer

play01:09

that's it here is the final output

play01:13

now we're going to customize its

play01:15

appearance so we go to the layer

play01:17

properties section

play01:20

and select render type from the

play01:22

symbology section

play01:25

we set it on platted

play01:28

and choose a color combination

play01:48

here you can see the slope command

play01:50

output

play02:13

aspect command generates an aspect map

play02:15

from any supported elevation raster

play02:17

aspect is the compass direction that a

play02:20

slope faces the pixels will have a value

play02:23

from 0 to 360 Degrees measured in

play02:25

degrees from North indicating the

play02:27

azimuth

play02:28

to perform this command go to the raster

play02:31

section

play02:32

select the aspect command from the

play02:34

analysis section

play02:39

select the desired layer

play02:54

you can set an output path

play03:06

done here you can see the aspect output

play03:18

Hill shade outputs a raster with a nice

play03:20

shaded relief effect it's very useful

play03:23

for visualizing the terrain you can

play03:25

optionally specify the Azimuth and

play03:27

altitude of the light source a vertical

play03:29

exaggeration factor and a scaling factor

play03:32

to account for differences between

play03:33

vertical and horizontal units to apply

play03:36

this command like slope and aspect

play03:38

select the hill shade option from the

play03:40

raster and Analysis section

play03:45

enter the desired layer as input

play03:49

note that the input must be a Dem

play03:56

you can define a storage path to the

play03:58

output

play04:01

you can change some parameters

play04:03

in the first step we do it by default

play04:13

here is the hill shade output

play04:22

brighter areas are areas where the sun

play04:24

shines directly on these areas

play04:30

select the hill shade again

play04:36

change the Azimuth of the sun this time

play04:40

by changing the Azimuth the angle of the

play04:42

sun will be different

play05:08

a contour line is a line drawn on a

play05:11

topographic map to indicate ground

play05:12

elevation or depression a contour

play05:15

interval is the vertical distance or

play05:17

difference in elevation between contour

play05:18

lines here to extract contour lines you

play05:22

need to go to the raster section select

play05:24

the Contour option from the extraction

play05:26

section

play05:29

the input should be the Dem layer

play05:35

you can also specify the distance

play05:37

between two contour lines here we set it

play05:40

on 10 meters to start so that a contour

play05:42

line is created for us every 10 meters

play05:45

because we have a large area and there

play05:47

are many 10 meter lines in this area it

play05:49

will take some time

play06:12

foreign

play06:33

a better color can be chosen

play06:40

areas with a high density of contour

play06:42

lines have more extreme elevation

play06:44

changes

play06:45

on the contrary the areas with lower

play06:48

density do not have many changes in

play06:50

altitude

play06:53

once again we set the distance between

play06:56

the two lines on 80 meters

play07:24

here the changes in the contour lines

play07:26

are clear

play07:29

foreign

Rate This
β˜…
β˜…
β˜…
β˜…
β˜…

5.0 / 5 (0 votes)

Related Tags
DEM AnalysisTerrain MappingSlope DegreesAspect MappingHillshade EffectContour LinesElevation DataGIS SoftwareTopographic MapRaster AnalysisVisual Terrain