Describing Distributions: Center, Spread & Shape | Statistics Tutorial | MarinStatsLectures
Summary
TLDRThis script discusses the verbal description of the shape, center, and spread of a numeric variable's distribution. It introduces the concept of symmetry and skewness in distributions, using examples to illustrate symmetric, skewed right, and skewed left distributions. The script also touches on the importance of anticipating distribution shapes for variables like income, height, and class grades before data collection. It sets the stage for future discussions on more quantitative measures of distribution, such as mean, median, standard deviation, and interquartile range.
Takeaways
- 📊 Describing a numeric variable's distribution involves discussing its shape, center, and spread.
- 🔍 Histograms and box plots are useful for summarizing the distribution of numeric variables visually.
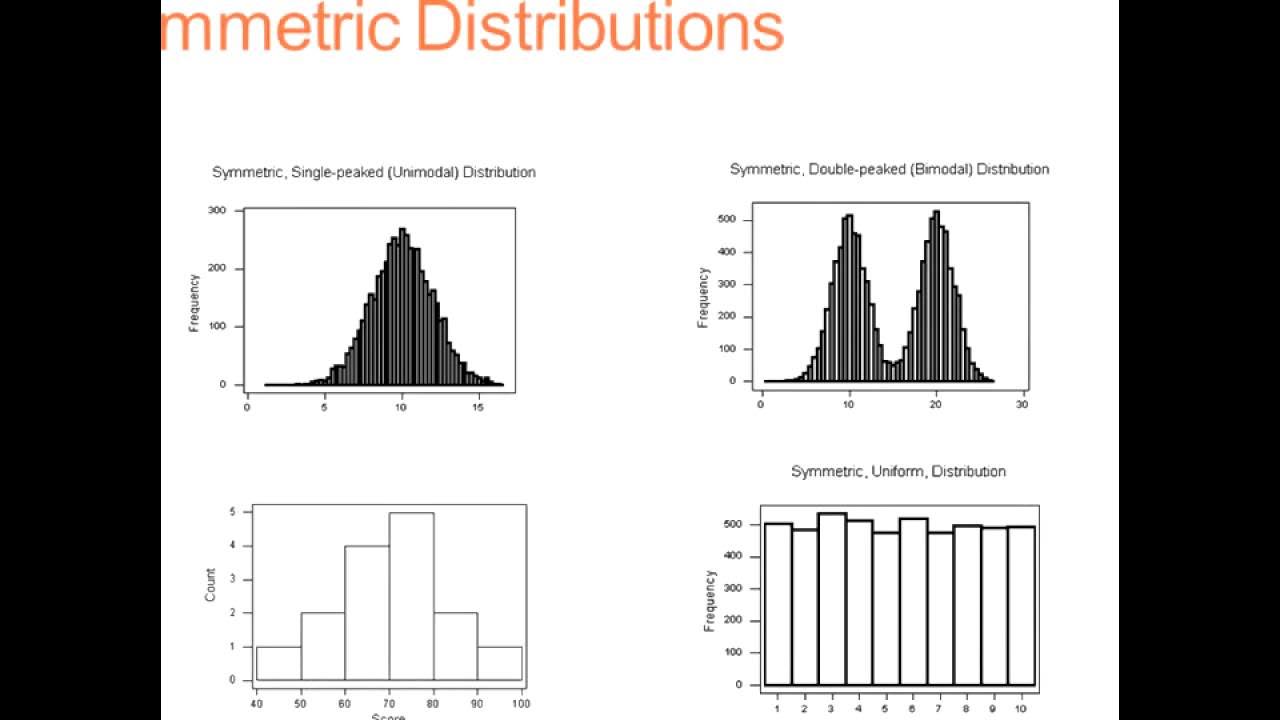
- 📈 The shape of a distribution can be symmetric or skewed, with skewness being towards the right (positive) or left (negative).
- 📚 A normal distribution is symmetric and bell-shaped, often used as a reference for many natural phenomena.
- 🤔 When considering the distribution of variables like income, height, or grades, it's helpful to predict their shape before data collection.
- 💼 Income distributions are often skewed right due to a lower bound and a long tail towards higher values.
- 🚹 Adult height distributions tend to be more symmetric and bell-shaped, with people evenly distributed around the average height.
- 📚 Grade distributions are typically skewed left or negatively skewed because they are capped at 100 and often have a lower tail towards zero.
- 📐 Measures of location, such as mean, median, and quartiles, help pinpoint the center of a distribution.
- 📉 Measures of spread or variability, like standard deviation, variance, and interquartile range, quantify how spread out the data is.
- 🔢 Quantitative descriptions of center and spread will be explored in more detail in subsequent videos, moving beyond qualitative descriptors.
Q & A
What are the two main characteristics of a distribution that are verbally described?
-The two main characteristics of a distribution that are verbally described are the shape of the distribution and the center and spread of the data.
What does a symmetric distribution imply about the data?
-A symmetric distribution implies that the data is evenly distributed around the center point, with both sides mirroring each other.
What is the term used to describe a distribution that is not symmetric and tails out to one side?
-A distribution that is not symmetric and tails out to one side is described as 'skewed.'
How is a distribution that tails out towards the right side characterized?
-A distribution that tails out towards the right side is characterized as 'positively skewed' or 'skewed right.'
What is meant by a 'normal' or 'bell-shaped' distribution?
-A 'normal' or 'bell-shaped' distribution refers to a symmetric distribution that decreases evenly on either side of the center, resembling the shape of a bell.
What is the expected shape of the distribution for individual incomes?
-The expected shape of the distribution for individual incomes is often 'skewed right,' indicating a lower bound with few individuals at the higher end.
Why are adult heights often symmetrically distributed?
-Adult heights are often symmetrically distributed because there is an average height, and people are evenly distributed above and below this average.
What is the typical distribution shape for class grades, and why?
-Class grades typically have a 'negatively skewed' or 'skewed left' distribution because grades are bounded between 0 and 100, with many students scoring above 50 and fewer scoring very low or very high.
What are some measures of location that can be verbally described for a distribution?
-Measures of location that can be verbally described for a distribution include the mean, median, maximum, minimum, and quartiles.
How is the spread or variability of a distribution verbally described?
-The spread or variability of a distribution is verbally described by terms like 'spread out,' 'variable,' 'tight,' or 'concentrated,' based on how the data points are dispersed around the center.
What are some quantitative measures that will be used to describe the center and spread of a distribution in future videos?
-Some quantitative measures that will be used to describe the center and spread of a distribution include mean, median, standard deviation, variance, and interquartile range.
Outlines
📊 Describing Distribution Shapes
This paragraph introduces the concept of verbally describing the shape, center, and spread of a distribution for a numeric variable. It emphasizes the importance of understanding different types of distributions through visualizations like histograms and box plots. The speaker provides examples of symmetric and skewed distributions, explaining the characteristics of each. The symmetric distributions are described as evenly distributed around a center, with one example resembling a normal distribution. Skewed distributions are further classified into right-skewed (positively skewed) and left-skewed (negatively skewed), based on the direction of the tail. The speaker also encourages the audience to consider the expected distribution shapes for variables such as income, height, and class grades before analyzing the data.
🔍 Exploring Distribution Descriptors and Measures
The second paragraph delves deeper into the descriptive language used to characterize distributions, such as 'exponentially distributed.' It also introduces measures of location and dispersion, which are crucial for understanding the distribution's central tendency and variability. The speaker discusses the concept of the distribution's center, using descriptive terms to pinpoint where the center might be for different examples. Furthermore, the paragraph touches on measures of location like maximum, minimum, quartiles, and percentiles, which were previously introduced in the context of box plots. The discussion on measures of spread includes the interquartile range and range, setting the stage for future quantitative measures like standard deviation and variance. The speaker concludes by hinting at upcoming videos that will provide more quantitative methods for analyzing the center and spread of distributions.
Mindmap
Keywords
💡Distribution
💡Symmetric Distribution
💡Skewed Distribution
💡Normal Distribution
💡Uniform Distribution
💡Center of Distribution
💡Spread
💡Quantitative Description
💡Histogram
💡Box Plot
💡Standard Deviation
Highlights
Introduction to verbally describing the shape, center, and spread of a distribution for a numeric variable.
Reminder to subscribe and click on the bell for notifications on new videos.
Discussion on different plots like histograms and box plots for summarizing distributions.
Explanation of verbally describing shapes as symmetric or skewed.
Description of a normal distribution and its characteristics.
Identification of a uniform distribution and its symmetric nature.
Definition and example of a positively skewed distribution.
Definition and example of a negatively skewed distribution.
Importance of considering expected distribution shapes before data collection.
Expected distribution shape for individual incomes, often skewed right.
Expected distribution shape for adult heights, typically symmetric and bell-shaped.
Expected distribution shape for class grades, often skewed left.
Introduction to more descriptive words for distribution shapes, such as exponentially distributed.
Discussion on measures of location, including mean, median, and percentiles.
Introduction to measures of spread or variability, such as standard deviation and variance.
Explanation of the interquartile range as a measure of spread.
Anticipation of upcoming videos that will quantify center and spread more formally.
Encouragement for viewers to stay tuned for more statistics content.
Transcripts
but let's talk a little bit about
verbally describing the shape as well as
center and spread of a distribution for
a numeric variable a quick reminder to
subscribe and click on the bell to
receive notifications when we upload new
videos so we've already talked a little
bit about different plots we can make
like a histogram or box plot and how
they summarize the distribution for a
numeric variable but let's start with
first verbally describing the shapes we
see as well as Center and spread and
then in following videos we'll get to
more quantitatively or numerically
describing some of these things so here
I've drawn for examples ABCD and they're
sort of artificial textbook very nice
and neat examples and again to make the
discussion easy for now so first let's
go through each each of these here and
attach kind of a qualitative or
descriptive label to the shape so what
we want to think about is the
distribution symmetric or skewed okay so
looking at this first one here it looks
like a nice symmetric distribution and
by that we mean if we pick a center
point in there it's roughly evenly or
symmetrically distributed around that
Center and a word we're gonna attach to
this later on is it looks sort of normal
okay or like a bell curve or a normal
distribution that's a topic that's
coming up pretty soon let's add that
descriptive label for now now this
second example will be here
and it looks fairly symmetric right if
we look at the center looks roughly
there and it looks pretty evenly or
symmetrically distributed around that
first let's add that word here it looks
pretty symmetrically distributed around
a center and this is one that later is
going to get called uniform okay evenly
or uniformly distributed okay so it's
symmetric and it's rather mean
bell-shaped and decreasing is fairly
evenly distributed around its center
then these two here look what we call
skewed they're not symmetric they kind
of tail out strongly to one side this
one here is skewed and it's skewed to
the right
what also gets positively skewed and
what gets called positively skewed now
the terminology can be a little bit
confusing at first but we say it's
skewed in the direction where it tails
out where the long tail is so this is
skewed towards the right side or towards
the positive or increasing numbers so
we'd call this skewed right and this
here again looks a little bit skewed and
it's tailing out towards the left so
this way to say it's skewed to the left
or it can be called negatively skewed
now often it's good to try and think
about the shape you'd expect for a
distribution of a variable when taking a
sample before collecting or exploring
the data so I'm going to give you three
examples to think about and well let me
mention those so suppose we take a
sample record income of individuals or
we record the heights of an adult
population or maybe record class grades
reported as percentages again for a
class so it's good to think about what
shape would you expect for the
distribution of these variables before
collecting them so take a moment to
think about that and then I'll get into
talking about what shape I would expect
them to have
you
when we collect incomes of individuals
these often have sort of a skewed right
distribution that's usually what we'd
expect and this often happens when
there's a lower bound
okay so incomes tend to clump somewhere
between zero and maybe fifty or a
hundred thousand maybe 150 thousand for
those are getting paid a little bit
nicer but then it tails up to other
words the right right this people making
five hundred thousand two million ten
million 20 million a year right there's
fewer of them right that's why it tails
down but they often tend to have skewed
right distributions if we think of
heights of adults right so once people
are no longer growing they tend to have
more symmetric distributions right
there's an average or mean or median
height and people are somewhat evenly
distributed above and below that and it
often tends to be a bit more normal or
bell-shaped if we think about class
grades now this is a tricky one people
often think normal right or symmetric
they're actually usually skewed to the
left or negatively skewed okay the
reason that happens is grades are bound
between 0 and 100 and often a class
averages depends on how well your class
goes but they're usually in the 70 to 80
range so definitely the average is
usually above 50 so there's usually some
average around here and they're capped
at 100 there's some really low grades
tailing down towards the zero okay so
looking at distribution of grades
they're actually often negative for the
skewed or skewed to the left
now think about symmetric skewed skewed
right skewed left there's often even
more descriptive words that we use
things like exponentially distributed or
things like that so you can take a look
at this graphic here and it's going to
show a few more examples of other
descriptive words that we might use to
describe the shape of a distribution
aside from describing the shape of the
distribution we also want to think about
some measures of location as well as
dispersion or variability the first one
we want to think about is the center
where is the center of the distribution
again just looking descriptively I would
say for this one it looks roughly there
looks roughly there for this one where
is the center
this somewhere around here somewhere
around here okay so those are just kind
of a very subjective we're gonna in
following videos learn about things like
the mean and care just what most people
know was an average or an arithmetic
average median and other measures of
center closely related or other measures
of location so things like what's the
maximum and the minimum or things we
mentioned when we learned about box
plots let's say the first quartile where
it cuts one quarter below three quarters
above so these are often referred to as
measures of location percentiles or what
also often gets called quantile the
words are interchangeable for the most
part some slight differences but we
won't get stuck on that for now and we
also want to think a bit about measures
of spread or variability so again
looking at example a and example B here
they've got roughly the same center
right so they've got roughly the same
mean or median but we can see here
example B is much more spread out than a
rate or much more variable is the word
we're gonna start to attach that right
now we're just using descriptive words B
is more spread out or more variable than
a but we're gonna start to quantify
these using things like standard
deviation or variance so those are
topics coming up things like the
interquartile range which we've touched
on when talking about box plots in a
separate video will more formally define
all these or even just things as simple
as the range what's the span from the
maximum to the minimum in a separate
video rather than using all these kind
of descriptive qualitative type words
we're going to start to quantify Center
and spread a little bit more almost as
beautiful as a limit going
stick around guys cuz we got a lot more
my dad is a statistics
ninja
Посмотреть больше похожих видео
Symmetry and Skewness (1.8)
Statistics-Left Skewed And Right Skewed Distribution And Relation With Mean, Median And Mode
Skewed Distributions and Mean, Median, and Mode (Measures of Central Tendency)
03. Cómo describir una variable numérica | Curso de SPSS
Histograms and Density Plots for Numeric Variables | Statistics Tutorial | MarinStatsLectures
Mode, Median, Mean, Range, and Standard Deviation (1.3)
5.0 / 5 (0 votes)