6050/6052 Unit 1 - Describing Distributions
Summary
TLDRThis video explores the key features of distributions for a single quantitative variable, focusing on shape, center, spread, and outliers. It discusses the importance of symmetry, skewness, and modality in analyzing distributions, including unimodal, bimodal, and multimodal types. The video explains how to measure the center (such as the mean or median) and the spread (range, interquartile range, and standard deviation). Additionally, it emphasizes identifying outliers and highlights the role of box plots in visualizing distribution characteristics. The goal is to effectively describe and summarize the distribution of a quantitative variable.
Takeaways
- 📊 Distributions of a single quantitative variable can be described by four main components: shape, center, spread, and outliers.
- 🔹 Shape involves symmetry, skewness, and modality, which describe the overall pattern of the data.
- ⚖️ Symmetric distributions have balanced left and right sides, while skewed distributions have longer tails on one side.
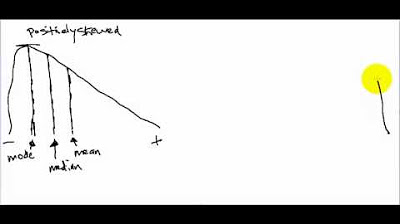
- 📈 Right-skewed distributions have longer right tails and more low values, whereas left-skewed distributions have longer left tails and more high values.
- 🎯 Modality refers to the number of peaks in a distribution: unimodal (one peak), bimodal (two peaks), or multimodal (more than two peaks).
- 🟦 Uniform distributions have no distinct peaks, meaning all values are approximately equally likely.
- 📍 The center of a distribution indicates the approximate location of the bulk of the data, which is easier to determine in symmetric distributions.
- 📏 Spread measures the variability of data and can be quantified using range, interquartile range (IQR), and standard deviation.
- ⚠️ Outliers are unusually large or small values that fall outside the general pattern and should be identified as part of the analysis.
- 👀 When analyzing distributions, focus on general trends rather than minor details to accurately summarize the data.
- 📚 Understanding shape, center, spread, and outliers collectively allows for a comprehensive description of a quantitative variable.
Q & A
What are the four main components used to describe the distribution of one quantitative variable?
-The four main components are shape, center, spread, and outliers.
How can the shape of a distribution be classified?
-Shape can be classified by symmetry or skewness and by modality, such as unimodal, bimodal, multimodal, or uniform.
What is a unimodal distribution?
-A unimodal distribution has a single peak or cluster of values, called a mode.
How does a skewed right distribution differ from a skewed left distribution?
-In a skewed right distribution, the right tail is longer and low values are more common, whereas in a skewed left distribution, the left tail is longer and high values are more common.
What is the difference between symmetric unimodal and symmetric bimodal distributions?
-A symmetric unimodal distribution has one peak and mirrored sides, while a symmetric bimodal distribution has two equal peaks but remains symmetrical overall.
What are the three measures of spread mentioned in the script?
-The three measures of spread are the range, interquartile range (IQR), and standard deviation.
How is the center of a distribution determined?
-The center represents the approximate location of the bulk of the data, and it is easier to identify in symmetric distributions than in skewed distributions.
What is an outlier and why is it important?
-An outlier is a value unusually high or low compared to the rest of the data. Identifying outliers is important because they may indicate errors, random chance, or meaningful variation.
What is a uniform distribution?
-A uniform distribution has no distinct mode, and all values are approximately equally likely.
Why should small or minor deviations in distribution shape be treated with caution?
-Small deviations may be due to random chance and may not reflect true characteristics of the population, so focus should be on general trends rather than minor details.
What is the meaning of multimodal distributions?
-Multimodal distributions have more than two peaks or modes, indicating multiple clusters of values within the data.
How can one visually compare the spread of two distributions?
-By presenting distributions on the same scale, differences in variability can be visually compared using graphs like histograms or box plots.
Outlines

This section is available to paid users only. Please upgrade to access this part.
Upgrade NowMindmap

This section is available to paid users only. Please upgrade to access this part.
Upgrade NowKeywords

This section is available to paid users only. Please upgrade to access this part.
Upgrade NowHighlights

This section is available to paid users only. Please upgrade to access this part.
Upgrade NowTranscripts

This section is available to paid users only. Please upgrade to access this part.
Upgrade NowBrowse More Related Video

Describing Distributions: Center, Spread & Shape | Statistics Tutorial | MarinStatsLectures
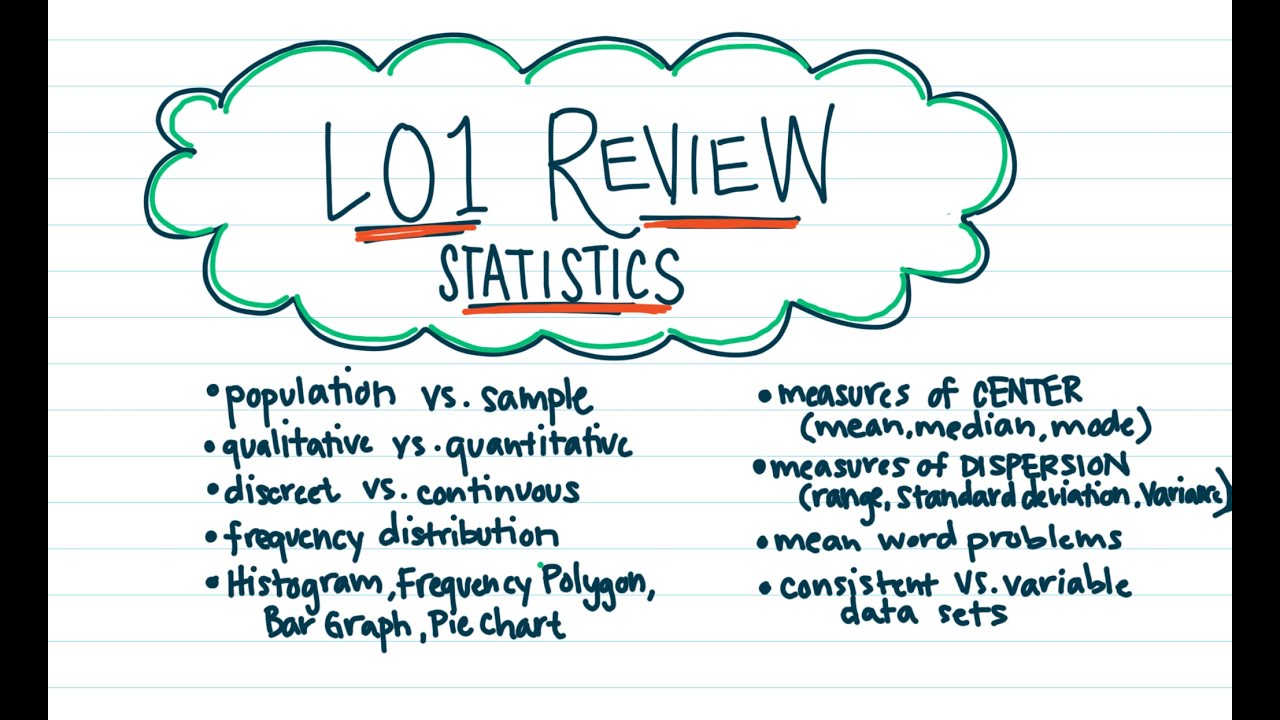
LO1 Review

Medidas de forma
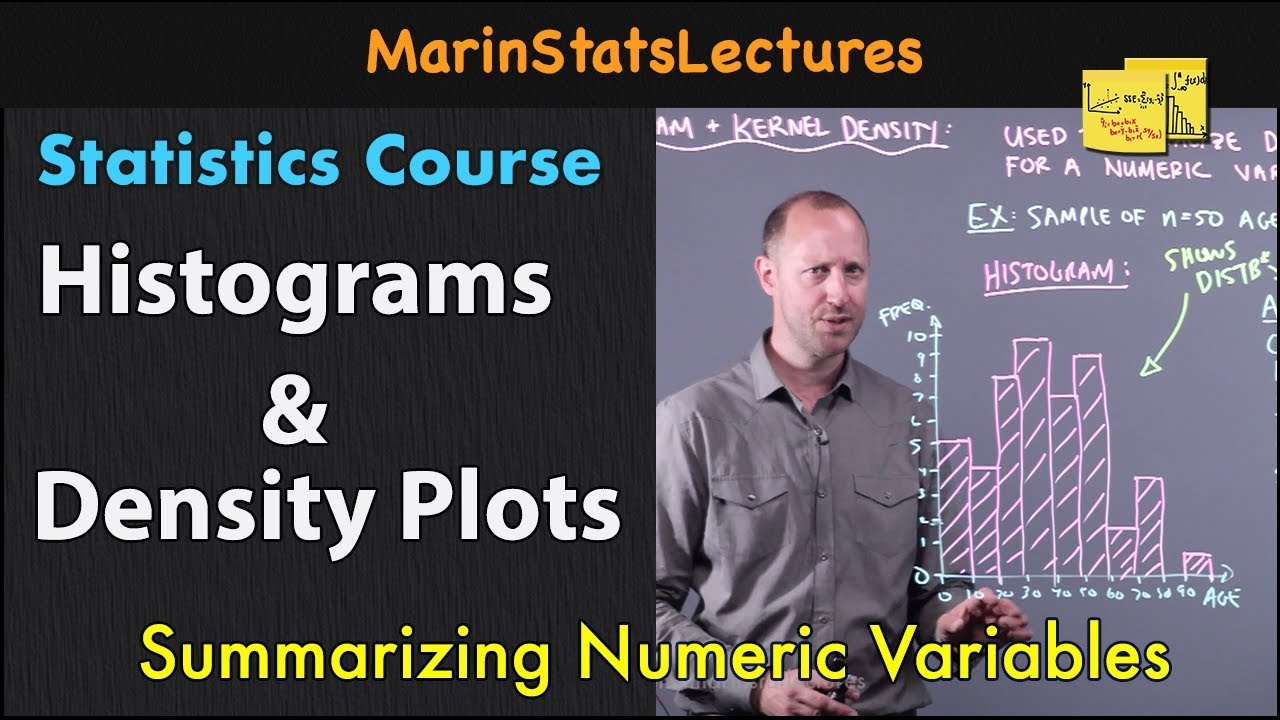
Histograms and Density Plots for Numeric Variables | Statistics Tutorial | MarinStatsLectures
Skewed Distributions and Mean, Median, and Mode (Measures of Central Tendency)

The Effects of Outliers on Spread and Centre (1.5)
5.0 / 5 (0 votes)