Standard Deviation and Variance
Summary
TLDRThe video script explains the concept of standard deviation as a measure of data dispersion around the mean. It illustrates the calculation process using an example of people's heights, emphasizing the difference between standard deviation and variance. The script clarifies that the standard deviation is the square root of the sum of squared deviations, divided by the number of observations (n) or n-1 for sample data, to estimate the population's standard deviation. The variance is the square of the standard deviation, making it less intuitive to interpret due to squared units, whereas the standard deviation retains the original data's unit, aiding in easier data interpretation.
Takeaways
- 📊 Standard Deviation is a statistical measure that quantifies the amount of variation or dispersion in a set of data values.
- 🧩 The mean (average) is calculated by summing all data points and dividing by the number of data points.
- 📏 Deviation is the difference between each data point and the mean value.
- 🔍 The standard deviation is found by taking the square root of the average of the squared deviations from the mean.
- 🌐 In the example given, the average deviation from the mean is 11.5 centimeters, which is the standard deviation.
- 📘 The standard deviation formula involves summing the squared differences from the mean and dividing by the number of values (n) or (n-1).
- 🔑 The choice between dividing by n or n-1 depends on whether the data represents a population or a sample.
- 🌐 When estimating a population standard deviation from a sample, n-1 is used, which is known as Bessel's correction.
- 🔄 The variance is the square of the standard deviation and is used to quantify the dispersion of data points around the mean.
- 📐 The standard deviation is easier to interpret than the variance because it is in the same unit as the original data, not squared.
- 📋 The script provides a clear explanation of the concepts of standard deviation and variance, and their calculation methods.
Q & A
What is the standard deviation?
-The standard deviation is a measure that indicates how much data scatter around the mean. It tells us how much, on average, the individual data points deviate from the mean value.
How is the mean calculated?
-The mean is calculated by summing the heights (or any other data points) of all individuals and dividing it by the number of individuals.
What does the standard deviation measure in the context of the given example?
-In the context of the given example, the standard deviation measures how much the heights of individuals in a group scatter around the mean height.
Why do we calculate the square of the deviations from the mean?
-We calculate the square of the deviations to ensure that all values are positive, as negative deviations would otherwise cancel out positive ones when summed.
What is the formula for calculating the standard deviation?
-The formula for calculating the standard deviation is the square root of the sum of the squared deviations divided by the number of values (n) or n-1, depending on whether the data represents a population or a sample.
What is the difference between dividing by n and n-1 in the standard deviation formula?
-Dividing by n is used when the data represents the entire population, while dividing by n-1 is used for a sample to provide an unbiased estimate of the population standard deviation.
Why is the standard deviation preferred over the variance for describing data?
-The standard deviation is preferred because it is in the same unit as the original data, making it easier to interpret. The variance, being the square of the standard deviation, is in the square of the original unit, which is more difficult to interpret.
What is the variance in relation to the standard deviation?
-The variance is the squared standard deviation. It represents the average of the squared deviations from the mean.
Why might the average deviation from the mean be different from the standard deviation?
-The average deviation from the mean would be different from the standard deviation because the standard deviation uses a quadratic mean (square root of the sum of squared deviations), whereas the average deviation would be the arithmetic mean of absolute deviations.
How does the standard deviation relate to the concept of a normal distribution?
-In a normal distribution, the standard deviation describes the spread of the data. Approximately 68% of the data falls within one standard deviation of the mean, and about 95% falls within two standard deviations.
Can you provide an example of how the standard deviation is used in real-life scenarios?
-The standard deviation is used in various scenarios such as measuring the variability in test scores, stock price fluctuations, or the range of heights in a population.
Outlines

このセクションは有料ユーザー限定です。 アクセスするには、アップグレードをお願いします。
今すぐアップグレードMindmap

このセクションは有料ユーザー限定です。 アクセスするには、アップグレードをお願いします。
今すぐアップグレードKeywords

このセクションは有料ユーザー限定です。 アクセスするには、アップグレードをお願いします。
今すぐアップグレードHighlights

このセクションは有料ユーザー限定です。 アクセスするには、アップグレードをお願いします。
今すぐアップグレードTranscripts

このセクションは有料ユーザー限定です。 アクセスするには、アップグレードをお願いします。
今すぐアップグレード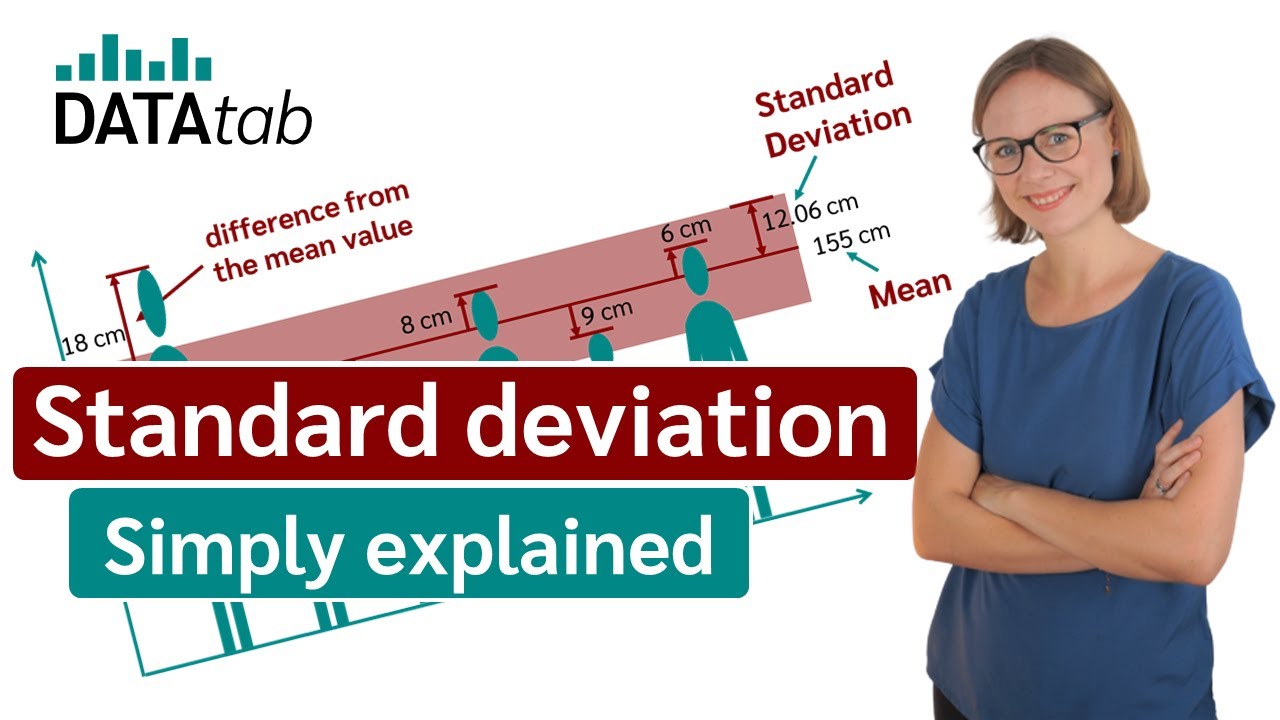


5.0 / 5 (0 votes)
