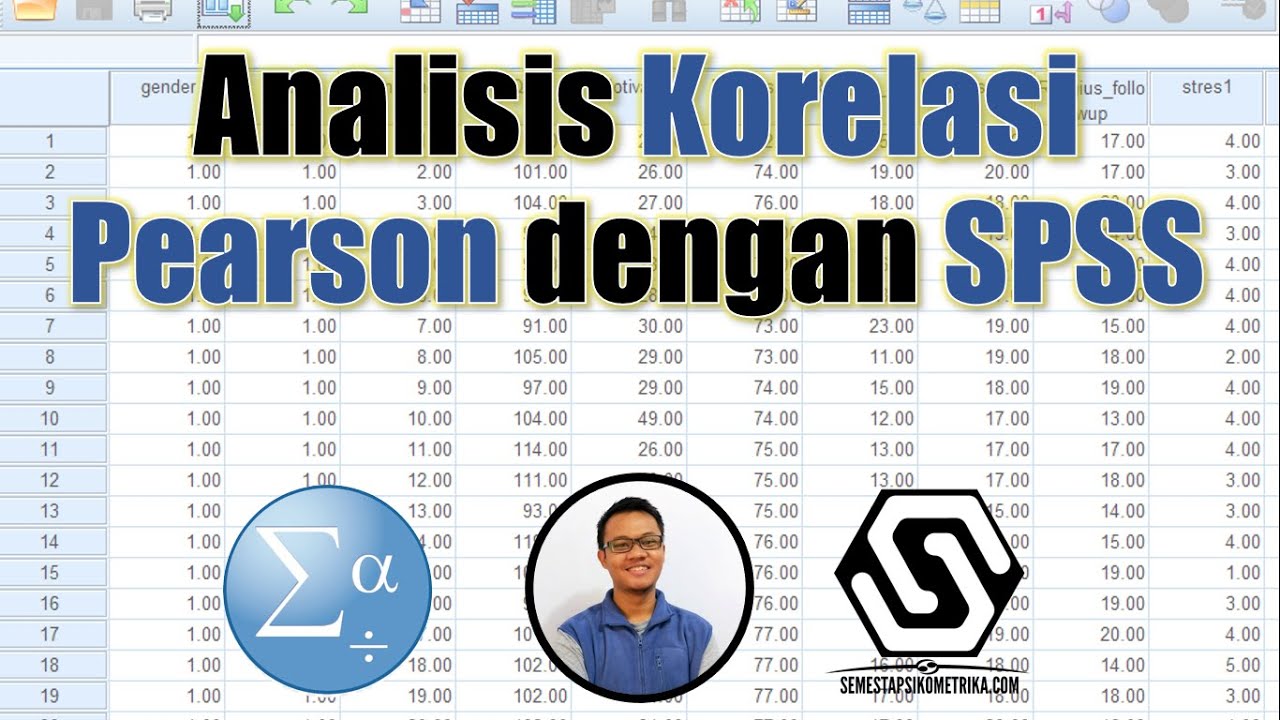
Tutorial Uji Korelasi Pearson dengan SPSS - Cara Uji Korelasi Product Moment
Summary
TLDRIn this tutorial, the speaker introduces the Pearson Product-Moment Correlation Analysis using SPSS, guiding viewers through the key concepts of correlation and normality tests. The tutorial covers how to check data normality using Kolmogorov-Smirnov tests and explains the steps for conducting the Pearson correlation analysis. The significance of correlation values and their interpretation are discussed, with examples showing strong and significant relationships between variables. The session is aimed at providing practical knowledge for users to perform correlation tests and understand the strength and direction of variable relationships in SPSS.
Takeaways
- 😀 The Pearson correlation test helps determine the strength and direction of the relationship between two variables.
- 😀 A positive Pearson correlation means both variables move in the same direction, while a negative correlation means they move in opposite directions.
- 😀 The product-moment Pearson correlation test requires interval or ratio data to be valid.
- 😀 Data used in the Pearson correlation test must be normally distributed. If the data is not normal, the Spearman correlation test should be used instead.
- 😀 The Kolmogorov-Smirnov test is used to check for the normality of the data before running the Pearson correlation test.
- 😀 A p-value (Asymp. Sig. 2-tailed) greater than 0.05 indicates that the data is normally distributed.
- 😀 To run the Pearson correlation test in SPSS, select Analyze → Correlate → Bivariate and enter the variables to be tested.
- 😀 If the significance value (p-value) in the Pearson correlation output is less than 0.05, there is a significant relationship between the variables.
- 😀 The Pearson correlation coefficient indicates the strength of the relationship: values between 0.80–1.0 indicate a very strong relationship.
- 😀 A positive Pearson correlation coefficient means that as one variable increases, the other also increases, while a negative value indicates that as one variable increases, the other decreases.
- 😀 The process of normality testing and correlation analysis in SPSS involves simple menu selections, making it accessible for users with basic SPSS knowledge.
Q & A
What is the purpose of Pearson's product-moment correlation test?
-The purpose of the Pearson’s product-moment correlation test is to determine the strength and direction of the relationship between two variables.
What type of data is suitable for the Pearson correlation test?
-The Pearson correlation test is used for data on an interval or ratio scale.
Why is it important to check the normality of data before performing the Pearson correlation test?
-It is important to check the normality of the data because the Pearson correlation test assumes that the data for each variable are normally distributed. If the data is not normal, an alternative test like the Spearman correlation should be used.
How do you test normality in SPSS?
-To test normality in SPSS, you can use the Kolmogorov-Smirnov test. This is done by selecting **Analyze** → **Nonparametric Tests** → **Legacy Dialogs** → **1-Sample KS**, and then checking the p-values for each variable.
What does a p-value greater than 0.05 indicate in the normality test?
-A p-value greater than 0.05 in the normality test indicates that the data for the variable are normally distributed.
What steps should be followed to perform the Pearson correlation test in SPSS?
-To perform the Pearson correlation test in SPSS, navigate to **Analyze** → **Correlate** → **Bivariate**, enter your variables into the dialog box, and then click **OK** to obtain the results.
How is the significance value (p-value) interpreted in the Pearson correlation test?
-In the Pearson correlation test, if the p-value is less than 0.05, it indicates that there is a statistically significant relationship between the variables. If the p-value is greater than 0.05, the relationship is not significant.
What does the Pearson correlation coefficient (r) represent?
-The Pearson correlation coefficient (r) represents the strength and direction of the relationship between two variables. A value closer to 1 or -1 indicates a stronger relationship, with positive values indicating a direct relationship and negative values indicating an inverse relationship.
What does a positive Pearson correlation coefficient indicate about the relationship between two variables?
-A positive Pearson correlation coefficient indicates that as one variable increases, the other variable also increases, meaning they move in the same direction.
What does a negative Pearson correlation coefficient indicate about the relationship between two variables?
-A negative Pearson correlation coefficient indicates that as one variable increases, the other variable decreases, meaning they move in opposite directions.
Outlines

このセクションは有料ユーザー限定です。 アクセスするには、アップグレードをお願いします。
今すぐアップグレードMindmap

このセクションは有料ユーザー限定です。 アクセスするには、アップグレードをお願いします。
今すぐアップグレードKeywords

このセクションは有料ユーザー限定です。 アクセスするには、アップグレードをお願いします。
今すぐアップグレードHighlights

このセクションは有料ユーザー限定です。 アクセスするには、アップグレードをお願いします。
今すぐアップグレードTranscripts

このセクションは有料ユーザー限定です。 アクセスするには、アップグレードをお願いします。
今すぐアップグレード


5.0 / 5 (0 votes)
