TUTORIAL SPSS : Multiple Correlation Test SPSS
Summary
TLDRIn this tutorial, the video explains how to perform a multiple correlation analysis using SPSS, starting with key concepts and moving through the actual SPSS process. It covers how to check data normality, interpret the normality test, and perform a multiple correlation test with two independent variables and one dependent variable. The video also discusses interpreting output, including significance values and the strength of the relationship (R value) between the variables. With a practical demonstration using SPSS version 26, this tutorial equips viewers with the knowledge to conduct and interpret a multiple correlation analysis effectively.
Takeaways
- 😀 Multiple correlation analysis examines the relationship between multiple independent variables and a dependent variable simultaneously.
- 😀 To perform a multiple correlation test, at least two independent variables are needed.
- 😀 The data used for multiple correlation tests should be normally distributed, meeting normality assumptions for parametric statistics.
- 😀 The normality test in SPSS can be performed using the 1-Sample Kolmogorov-Smirnov (KS) test.
- 😀 If the P-value from the normality test is greater than 0.05, the data is considered normally distributed.
- 😀 SPSS's linear regression analysis is used to perform the multiple correlation test, with the dependent variable on the left and independent variables on the right.
- 😀 A significant F Change value (less than 0.05) indicates a significant relationship between the independent and dependent variables.
- 😀 If the F Change significance value is greater than 0.05, it suggests that there is no significant relationship between the variables.
- 😀 The R value indicates the strength of the relationship; an R value of 0.880 suggests a very strong relationship between the variables.
- 😀 Normality tests for variables X1, X2, and Y all show P-values greater than 0.05, indicating that all variables are normally distributed.
- 😀 The multiple correlation test provides insight into the combined relationship between independent variables (X1, X2) and the dependent variable (Y).
Q & A
What is the purpose of a multiple correlation test?
-A multiple correlation test is used to assess whether there is a relationship between multiple independent variables and a dependent variable simultaneously.
How many independent variables are required for a multiple correlation test?
-At least two independent variables are required to conduct a multiple correlation test.
What type of data is needed for a multiple correlation test?
-The data should be interval or ratio data, and it must meet the assumptions of normality.
What does the normality test check for in the data?
-The normality test checks whether the data follows a normal distribution. If the significance value (P-value) is greater than 0.05, the data is considered normally distributed.
How do you perform a normality test in SPSS?
-In SPSS, you go to the 'Analyze' menu, select 'Nonparametric Tests', choose 'Legacy Dialogs', then select '1-Sample KS'. Enter the variables into the right column and click 'OK' to view the normality test results.
What does it mean if the P-value in the normality test is less than 0.05?
-If the P-value is less than 0.05, it means the data is not normally distributed, and the normality assumption is not met.
How can you determine if the normality assumption is met for a variable?
-You can determine if the normality assumption is met by checking the significance value (P-value) in the normality test output. If the value is greater than 0.05, the data is normally distributed.
How do you perform a multiple correlation test in SPSS?
-To perform a multiple correlation test in SPSS, go to 'Analyze', select 'Regression', and then 'Linear'. Add the dependent variable to the 'Dependent' column and the independent variables to the 'Independent' column. Afterward, select 'Statistics' and check 'R-Square Change', then click 'OK'.
What does the F-change significance value represent in the multiple correlation test?
-The F-change significance value helps determine whether there is a significant relationship between the independent variables and the dependent variable. If the F-change significance value is less than 0.05, it indicates a significant relationship.
How is the strength of the relationship between variables determined in a multiple correlation test?
-The strength of the relationship is indicated by the R value, which represents the correlation coefficient. An R value closer to 1 suggests a very strong relationship, while an R value closer to 0 indicates a weaker relationship.
Outlines

This section is available to paid users only. Please upgrade to access this part.
Upgrade NowMindmap

This section is available to paid users only. Please upgrade to access this part.
Upgrade NowKeywords

This section is available to paid users only. Please upgrade to access this part.
Upgrade NowHighlights

This section is available to paid users only. Please upgrade to access this part.
Upgrade NowTranscripts

This section is available to paid users only. Please upgrade to access this part.
Upgrade NowBrowse More Related Video

Tutorial Uji Korelasi Pearson dengan SPSS - Cara Uji Korelasi Product Moment
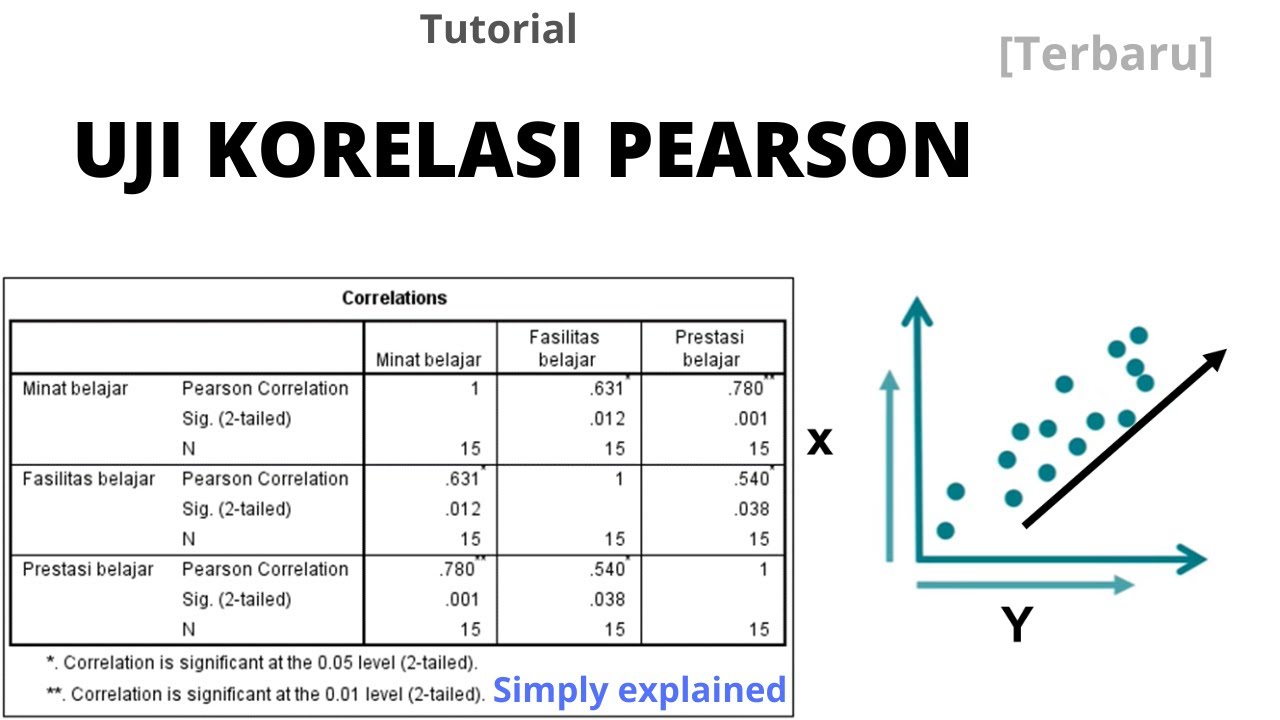
Memahami Uji Korelasi Pearson dan Cara Analisis dengan SPSS
Pearson Correlation Analysis using SPSS - Running, Interpreting, and Reporting

Cara Uji Korelasi Dengan SPSS
validitas, reliabilitas, tingkat kesukaran dan daya pembeda menggunakan aplikasi SPSS 26.

Cara Uji Validitas dan Reliabilitas kuesioner penelitian menggunakan aplikasi SPSS
5.0 / 5 (0 votes)