What is average rate of change?

Krista King
31 Jan 201704:31

Summary

TLDRThe video script explains the concept of average rate of change as the ratio of the change in the dependent variable to the change in the independent variable. It parallels this concept with speed, illustrating it as the total distance over time. The formula for average rate of change is presented as the difference in function values over the difference in x-values between two points, equating to the slope of the secant line. The script clarifies that average rate of change can be positive, negative, or zero, and contrasts it with instantaneous rate of change, which requires derivatives. It concludes with practical applications, such as calculating a marathon runner's average speed, emphasizing its usefulness despite not capturing every detail of a function's behavior.

Takeaways

  • 📊 The average rate of change is the total change in the dependent variable (y) over the total change in the independent variable (x).
  • đŸƒâ€â™‚ïž The concept is often related to speed, representing the total distance covered over a certain amount of time.
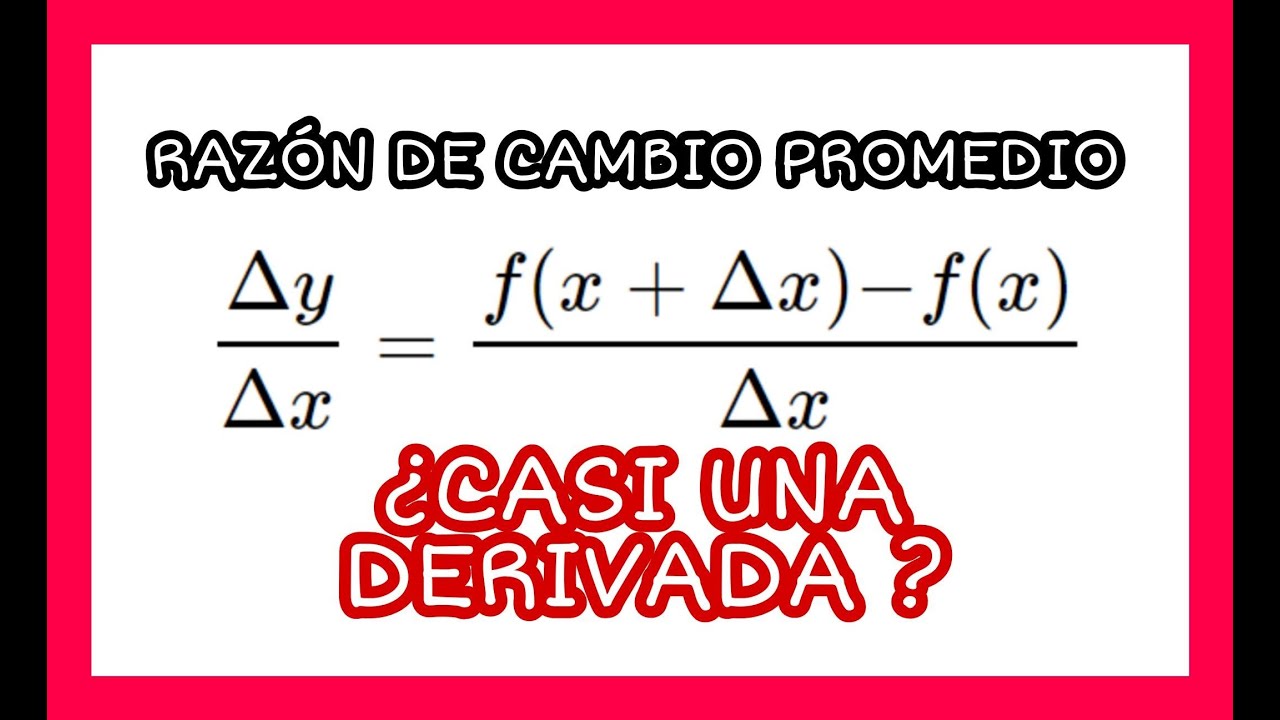
  • 🔍 The formula for average rate of change is \( \frac{f(x_2) - f(x_1)}{x_2 - x_1} \), where \( (x_1, f(x_1)) \) is the starting point and \( (x_2, f(x_2)) \) is the endpoint.
  • 📚 This formula is the same as that used to find the slope of a line, specifically the slope of the secant line between two points on a graph.
  • ↗ The average rate of change can be negative, positive, or zero, reflecting the direction and magnitude of change in y relative to x.
  • ⛔ A negative average rate of change occurs when \( f(x_2) \) is less than \( f(x_1) \), indicating a decrease in the function's value.
  • âŹ†ïž Conversely, a positive average rate of change indicates an increase, where \( f(x_2) \) is greater than \( f(x_1) \).
  • 🔄 An average rate of change of zero suggests no change in the function's value between the two points, even if there is movement, like a ball thrown and returned.
  • 📉 The average rate of change does not provide information about the instantaneous rate of change or the slope of the curve at a specific point.
  • 📝 To find the instantaneous rate of change, one would need to calculate the derivative of the function.
  • 📊 The average rate of change is useful for general insights into a function's behavior, such as a runner's average speed over a marathon.

Q & A

  • What is the average rate of change in the context of a function?

    -The average rate of change of a function is the total change in the dependent variable (f(x)) over the total change in the independent variable (x), and it can be calculated using the formula (f(x2) - f(x1)) / (x2 - x1).

  • How is the concept of average rate of change related to speed?

    -The average rate of change is related to speed as it represents the total distance covered over a certain amount of time, which is the definition of average speed.

  • What is the formula for the average rate of change between two points on a function?

    -The formula for the average rate of change between two points (x1, f(x1)) and (x2, f(x2)) on a function is f(x2) - f(x1) over x2 - x1.

  • Why is the formula for the average rate of change similar to the equation for finding the slope of a line?

    -The formula for the average rate of change is similar to the slope of a line because it calculates the slope of the secant line between two points on the graph of a function, which is a straight line connecting those two points.

  • What does the average rate of change indicate about the direction of change between two points?

    -The average rate of change indicates the direction of change between two points: it is negative when f(x2) is less than f(x1), positive when f(x2) is greater than f(x1), and zero when f(x2) equals f(x1), resulting in a horizontal secant line.

  • Why might the average rate of change be zero even if there was movement?

    -The average rate of change can be zero even if there was movement because it represents the net change over a period. For example, if an object returns to its starting point, the total change in position is zero, resulting in an average rate of change of zero.

  • How is the average rate of change different from the rate of change at a specific moment?

    -The average rate of change is different from the rate of change at a specific moment because it provides a general idea about the behavior of a function over an interval, whereas the instantaneous rate of change, found using the derivative, gives the slope of the curve at a specific point.

  • What is the purpose of calculating the average rate of change in practical scenarios like reporting on marathon runners?

    -In practical scenarios, such as reporting on marathon runners, the average rate of change is used to provide a general measure of performance over the entire event, like average speed, rather than the speed at every given second.

  • How can you calculate the average speed of a marathon runner over the entire race using a table of times for each mile?

    -To calculate the average speed of a marathon runner over the entire race, you would use the total change in distance (26.2 miles) over the total time elapsed, summing up the increments of time if the times are not cumulative.

  • What is the significance of the average rate of change in understanding the behavior of a function?

    -The average rate of change is significant in understanding the behavior of a function as it gives a general idea about the function's behavior over an interval, indicating trends of increase, decrease, or stability, without providing specific details about the rate of change at individual points.

Outlines

00:00

📊 Understanding Average Rate of Change

This paragraph introduces the concept of average rate of change, explaining it as the total change in the dependent variable (y) over the total change in the independent variable (x). It draws an analogy to speed, where average rate of change equates to total distance over time. The formula for average rate of change is presented as f(x_2) - f(x_1) over x_2 - x_1, highlighting its equivalence to the slope formula of a line. The paragraph further explains that this formula calculates the slope of the secant line between two points on a function graph. It clarifies that the average rate of change can be negative, positive, or zero, reflecting the direction and magnitude of change between two points. The discussion also touches on the limitations of average rate of change in representing the instantaneous rate of change or the slope of the curve at a specific point, suggesting that the derivative is needed for such detailed analysis.

Mindmap

Keywords

💡Average Rate of Change

The average rate of change is a mathematical concept that measures the total change in the dependent variable (often represented as 'y') divided by the total change in the independent variable (often 'x'). It is central to the video's theme as it explains how to calculate the rate at which a quantity changes over a given interval. In the context of the video, it's likened to speed, where the average rate of change represents the total distance covered over a certain amount of time, and is calculated using the formula f(x_2) - f(x_1) over x_2 - x_1.

💡Dependent Variable

In the script, the dependent variable is the value that changes in response to changes in another variable. It is denoted as 'y' and is the focus of the rate of change calculation. The video explains that the average rate of change is concerned with the total change in the dependent variable over the total change in the independent variable.

💡Independent Variable

The independent variable is the variable that is changed or manipulated in an experiment or calculation, often represented as 'x'. In the video, it is described as the variable over which the change in the dependent variable is measured to calculate the average rate of change.

💡Secant Line

A secant line is a straight line that connects two points on a graph, representing the average rate of change between those points. The video script uses the concept of a secant line to illustrate how the average rate of change is calculated, emphasizing that it is the slope of this line between two points on a function's graph.

💡Slope

Slope is a measure of the steepness of a line, and in the context of the video, it is used to describe the average rate of change. The script explains that the formula for average rate of change is the same as the one used to find the slope of a line, specifically the slope of the secant line between two points on a function's graph.

💡Negative Rate of Change

A negative rate of change occurs when the value of the dependent variable decreases as the independent variable increases. The video script mentions that the average rate of change will be negative when f(x_2) is less than f(x_1), which is demonstrated by the subtraction of the function values in the formula.

💡Positive Rate of Change

A positive rate of change indicates an increase in the dependent variable as the independent variable increases. The script explains that the average rate of change is positive when f(x_2) is greater than f(x_1), which is a direct result of the subtraction in the average rate of change formula.

💡Zero Rate of Change

A zero rate of change suggests that there is no change in the dependent variable as the independent variable changes. The video script points out that if f(x_2) equals f(x_1), the secant line is horizontal, and the average rate of change is zero, even if the function has experienced changes elsewhere.

💡Instantaneous Rate of Change

The instantaneous rate of change is the rate of change at a specific point, as opposed to the average rate of change over an interval. The video script distinguishes between the two by stating that the average rate of change does not provide information about the instantaneous rate of change, which requires the calculation of the derivative of the function.

💡Derivative

In the context of the video, the derivative is a mathematical operation that gives the instantaneous rate of change of a function at a specific point. It is mentioned as a way to find out more about the rate of change at a particular moment, contrasting with the average rate of change which provides a general idea of the function's behavior over an interval.

💡Marathon Runners

The video script uses the example of marathon runners to illustrate the practical application of calculating the average rate of change. It suggests that while reporting the speed of a runner at every second would be tedious, knowing the average speed over the course of the race is both interesting and informative.

Highlights

The average rate of change is the total change in the dependent variable over the total change in the independent variable.

Average rate of change is often related to speed, representing distance covered over time.

The concept of average rate of change applies to any change in y over any change in x, not just speed.

The formula for average rate of change is f(x_2) - f(x_1) over x_2 - x_1, for points on a function.

The average rate of change formula is identical to the slope formula of a line.

The average rate of change calculates the slope of the secant line between two points on a graph.

A secant line is a straight line connecting two points on a function.

The average rate of change can be negative, positive, or zero, similar to the slope of a line.

A negative average rate of change occurs when f(x_2) is less than f(x_1).

A positive average rate of change indicates f(x_2) is greater than f(x_1).

An average rate of change of zero suggests a horizontal secant line when f(x_2) equals f(x_1).

An average rate of change of zero does not necessarily mean no change occurred.

The average rate of change does not provide information about the rate of change at a specific moment.

Instantaneous rate of change is found using the derivative of a function.

The average rate of change is useful for summarizing information, such as a runner's average speed over a marathon.

To find the average speed over a race, use the total change in distance over the total time elapsed.

When times are not cumulative, sum the increments of time to calculate the average rate of change.

The average rate of change provides a general idea about a function's behavior but does not reveal everything.

Transcripts

play00:00

When we talk about average rate of change, what we're really talking about is the total

play00:04

change in the dependent variable over the total change in the independent variable.

play00:07

A lot of discussions about average rate of change relate to speed.

play00:14

And in that case, the average rate of change represents the total distance covered over

play00:18

a certain amount of time.

play00:19

But really, we can talk about any change in y over any change in x, regardless of what

play00:25

x and y represent.

play00:27

And this brings us to the formula for the average rate of change between two points

play00:31

on a function.

play00:32

The average rate of change of a function is given by f(x_2) minus f(x_1) over x_2 minus

play00:39

x_1, where (x_1, f(x_1)) is the starting point of the interval we are interested in and (x_2,

play00:47

f(x_2)) is the endpoint.

play00:48

If you've spent any time studying linear equations, you'll probably recognize that this formula

play00:53

for average rate of change is exactly the same as the equation to find the slope of

play00:58

the line!

play00:59

More specifically, the formula for the average rate of change calculates the slope of the

play01:05

secant line between two points on the graph of a function.

play01:08

A secant line is simply a straight line connecting two points on a function, which is exactly

play01:14

what the average rate of change calculates.

play01:17

The average rate of change of a function can be negative, positive, or even zero, just

play01:22

like the slope of the secant line.

play01:25

The average rate of change of a function will be negative when f(x_2) is less than f(x_1),

play01:31

which makes sense both when we draw the secant line on the graph and when we realize what

play01:35

subtracting f(x_1) from f(x_2) will do to our equation.

play01:40

Likewise, the average rate of change will be positive whenever f(x_2) is greater than

play01:46

f(x_1).

play01:47

In the same way, if f(x_2) and f(x_1) are equal to each other, the secant line will

play01:54

be horizontal and the numerator of the formula will be zero, so the average rate of change

play01:59

will also be zero.

play02:01

This can be tricky, because even if the average rate of change is zero, it doesn't necessarily

play02:05

mean that no change occurred.

play02:08

After all, if I threw a ball into the air, and it came right back into my hand, the graph

play02:13

of its change in height over time would look like this.

play02:16

The ball definitely moved, but if I asked you for the average rate of change from this

play02:20

point to this point, you would get zero.

play02:24

So clearly, finding the average rate of change is not the same thing as knowing the rate

play02:28

of change at any particular moment.

play02:31

Rate of change is represented on a graph as the slope of a curve, and looking at this

play02:35

function and the secant line found using the average rate of change formula, it's clear

play02:39

that the average rate of change doesn't tell us anything at all about the actual rate of

play02:43

change at this point or the slope of the curve at this point.

play02:48

To find out more about these, we would need to calculate the instantaneous rate of change

play02:52

by using the derivative of the function.

play02:55

In a lot of cases though, we only need to know the average rate of change of a function,

play02:58

like if we were writing a report on marathon runners.

play03:01

It would be pretty boring to report the speed of the runner at every given second, but it

play03:06

is pretty cool to know a runner's average speed over the course of the race.

play03:09

Let's look at how we could figure that out.

play03:12

Say we're given this table of this runner's time for each mile of the marathon.

play03:16

We could easily find her average speed at each mile by plugging into the formula the

play03:22

change in distance, one mile, over the amount of time elapsed.

play03:26

But if we wanted to find her average speed over the course of the race, we would need

play03:30

the total change in distance, 26.2 miles, over the total time elapsed.

play03:35

In a table like this, where the times are not cumulative, we would need to sum up the

play03:39

increments of time in order to plug the right amount into the average rate of change formula.

play03:44

So to summarize, we've talked all about average rate of change and its relationship to the

play03:50

secant line.

play03:52

We now know how to calculate the average rate of change when given two points on a curve

play03:55

to use as an interval, and we know how to use information from a chart to do the same

play04:00

thing.

play04:01

We definitely know that the average rate of change doesn't tell us everything there is

play04:05

to know about a function, but it does give us a general idea about its behavior!

Rate This
★
★
★
★
★

5.0 / 5 (0 votes)

Étiquettes Connexes
Average ChangeRate of ChangeSecant LineSlope FormulaSpeed AnalysisMarathon RunnersGraph InterpretationInstantaneous RateDerivativeData Analysis
Besoin d'un résumé en anglais ?