SolidWorks Simulation Tutorial - تمارين علي برنامج السولدوركس سيميوليشن بالعربي
Summary
TLDRIn this tutorial, the instructor explains how to calculate the stress in a beam subjected to a distributed load using a program. The video covers the process of modeling a cross-section, calculating stresses, and using the software to simulate the scenario. The instructor provides step-by-step instructions on how to input the beam's dimensions, load distribution, and boundary conditions, then compares the results with manual calculations. The video concludes with an animated visualization of the load’s effect on the beam, demonstrating how to analyze and solve similar problems using both theoretical methods and software tools.
Takeaways
- 😀 The exercise focuses on calculating stress in a beam subjected to a distributed load, using both theoretical formulas and software tools.
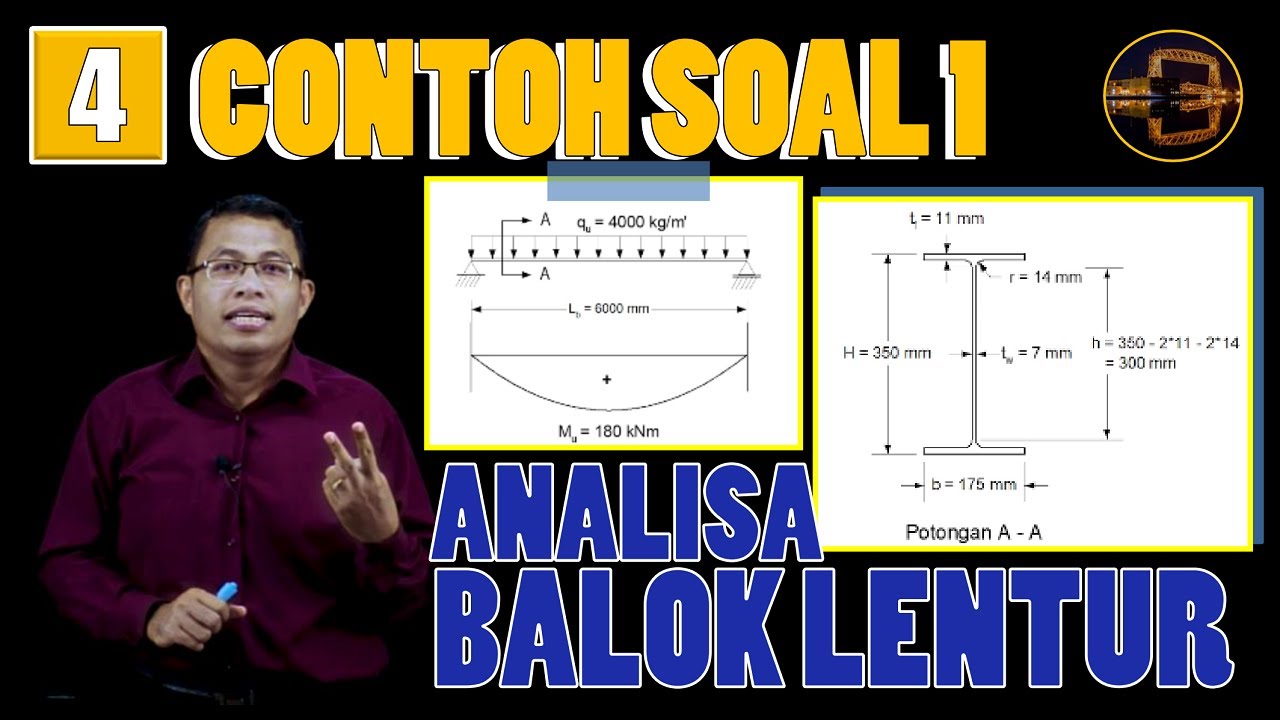
- 😀 The beam has a specific cross-section with dimensions 250 mm in width, 300 mm in height, and additional 20 mm at the top and bottom.
- 😀 The length of the beam is 6 meters, and the cross-section dimensions are crucial for the stress calculation process.
- 😀 The distributed load applied on the beam is 5 kN/m, and the goal is to calculate the resulting stress due to this load.
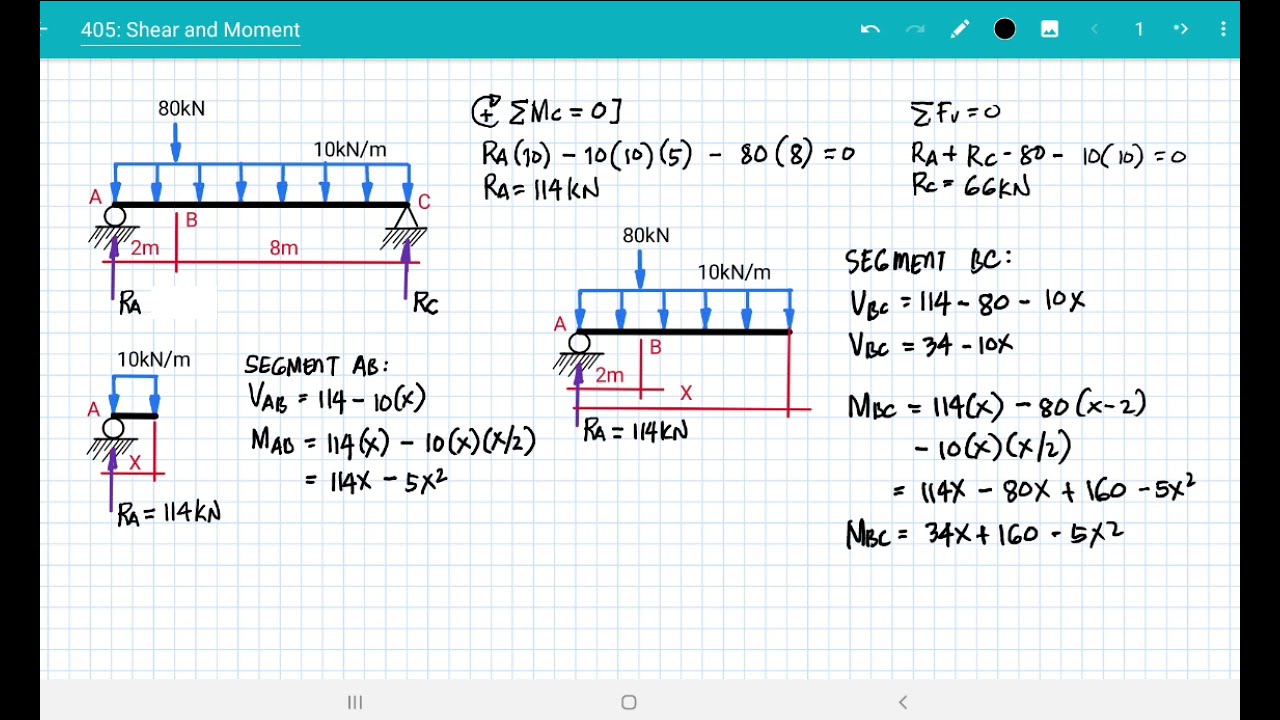
- 😀 To calculate the stress, the equation σ = M * y / I is used, where M is the bending moment, y is the distance from the neutral axis, and I is the second moment of area.
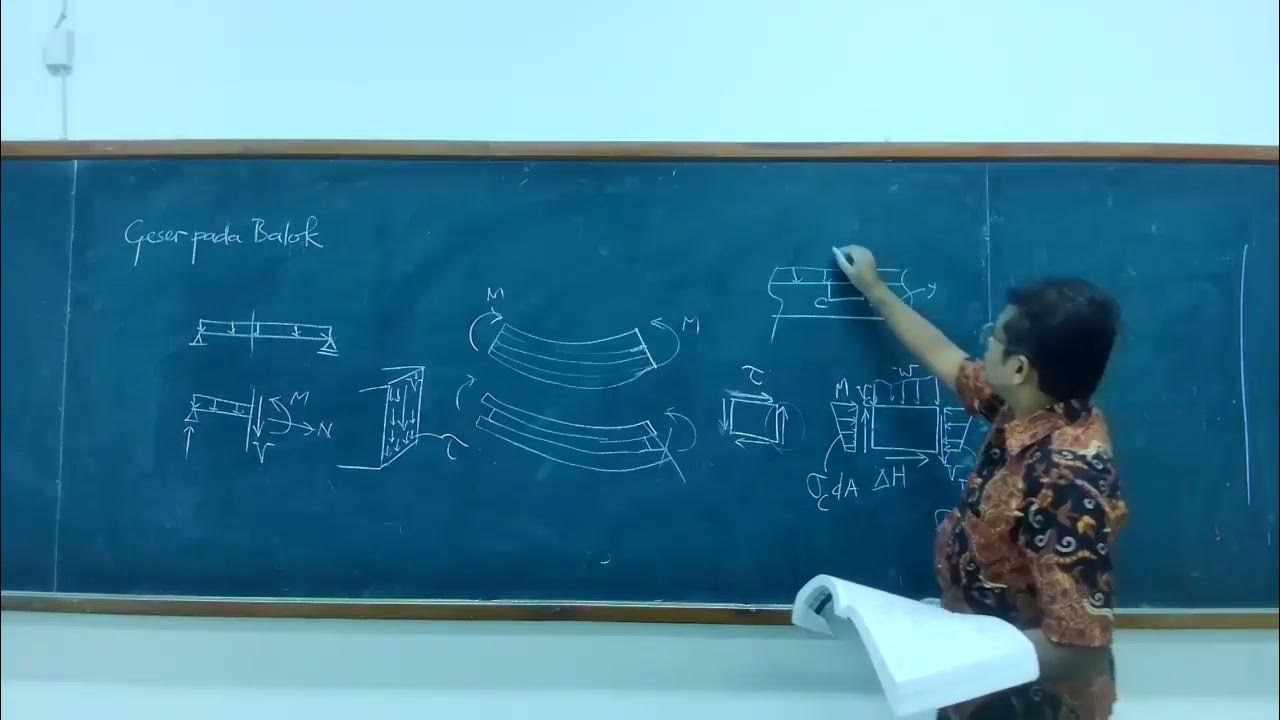
- 😀 The calculation of the bending moment involves determining the moment at different sections of the beam, including considering symmetry and dimensions.
- 😀 A key step involves calculating the moment of inertia (I) for the beam's cross-section, which is necessary for stress computation.
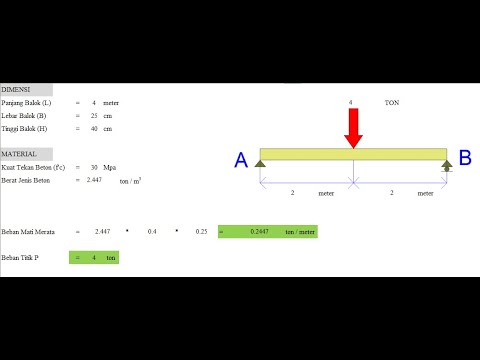
- 😀 Using the software, the beam model is created, and various conditions such as fixed supports and load application are defined.
- 😀 The program allows for the transformation of a distributed load into a concentrated load for easier analysis and visualization.
- 😀 The software generates the stress results, showing a maximum stress of 12.7 MPa at the red-colored region, which matches the theoretical calculation.
- 😀 The video also demonstrates the use of animation to visualize the effect of the applied load on the beam, which helps in understanding the stress distribution.
Q & A
What is the main topic of the video?
-The video is focused on teaching how to calculate stresses and analyze a beam with a specific cross-section using engineering software.
What are the dimensions of the beam's cross-section mentioned in the video?
-The cross-section dimensions are 250 mm width, 300 mm height plus 20 mm for the top flange and 20 mm for the bottom flange, making a total length of 340 mm.
What type of load is applied to the beam in the example?
-A uniformly distributed load of 5 kN/m is applied along the length of the beam.
Which formula is used to calculate the stress in the beam?
-The stress is calculated using the formula σ = M*y/I, where M is the bending moment, y is the distance from the neutral axis, and I is the moment of inertia.
How is the moment of inertia (I) determined according to the video?
-The moment of inertia is calculated based on the beam's cross-sectional shape using standard formulas or by decomposing the section into simpler shapes.
What value of maximum stress is obtained in the example?
-The maximum stress obtained is 12.7 MPa.
What are the steps for modeling the beam in the software?
-First, draw the beam shape (I-section) with correct dimensions, define symmetry, assign material properties, set boundary conditions, and then apply the load.
How is the distributed load handled in the software?
-The software converts the distributed load into an equivalent concentrated load applied at the appropriate locations on the beam.
What types of analysis can be performed using the software as mentioned in the video?
-The software can perform static, thermal, buckling, and dynamic analyses.
How are the results verified for accuracy?
-Results from the software are compared with hand calculations using formulas to ensure consistency and accuracy.
What visual indicators does the software provide for stress distribution?
-The software uses color coding, such as red for maximum stress and blue for minimum stress, to show stress distribution along the beam.
What is the final step demonstrated in the video after completing the analysis?
-The final step is animating the model to visualize how the beam deforms under the applied load.
Outlines

Cette section est réservée aux utilisateurs payants. Améliorez votre compte pour accéder à cette section.
Améliorer maintenantMindmap

Cette section est réservée aux utilisateurs payants. Améliorez votre compte pour accéder à cette section.
Améliorer maintenantKeywords

Cette section est réservée aux utilisateurs payants. Améliorez votre compte pour accéder à cette section.
Améliorer maintenantHighlights

Cette section est réservée aux utilisateurs payants. Améliorez votre compte pour accéder à cette section.
Améliorer maintenantTranscripts

Cette section est réservée aux utilisateurs payants. Améliorez votre compte pour accéder à cette section.
Améliorer maintenantVoir Plus de Vidéos Connexes
[ 405 ] SHEAR & MOMENT DIAGRAM

What are Flexural Stresses / Bending Stresses
Contoh Perhitungan Analisa Balok Anak dgn Plastik Sempurna (Leleh Umum) | Struktur Baja | Lightboard

FEA 28: Distributed Loads with Isoparametric Elements
Belajar SAP2000 Pemula (Bagian ke-1 Balok Sederhana)
09-05 Tegangan geser pada balok
5.0 / 5 (0 votes)
