[ 405 ] SHEAR & MOMENT DIAGRAM
Summary
TLDRThe video demonstrates how to draw the shear force and bending moment diagrams for a beam subjected to a uniformly distributed load and a concentrated load. It guides viewers step-by-step, starting with calculating the reactions at supports, followed by deriving shear and moment equations for each beam segment. The tutorial explains how to evaluate key points along the beam to determine shear and moment values, and highlights the characteristics of the diagrams, including linear and parabolic behavior. The video emphasizes understanding the relationship between loads, shear, and bending moments, culminating in a clear, methodical approach to sketching accurate structural diagrams.
Takeaways
- 🛠️ The task involves drawing the shear and bending moment diagrams of a beam using the shear and moment equations.
- 📐 The first step is to determine the external reactions at the beam supports by summing moments and considering clockwise rotation as positive.
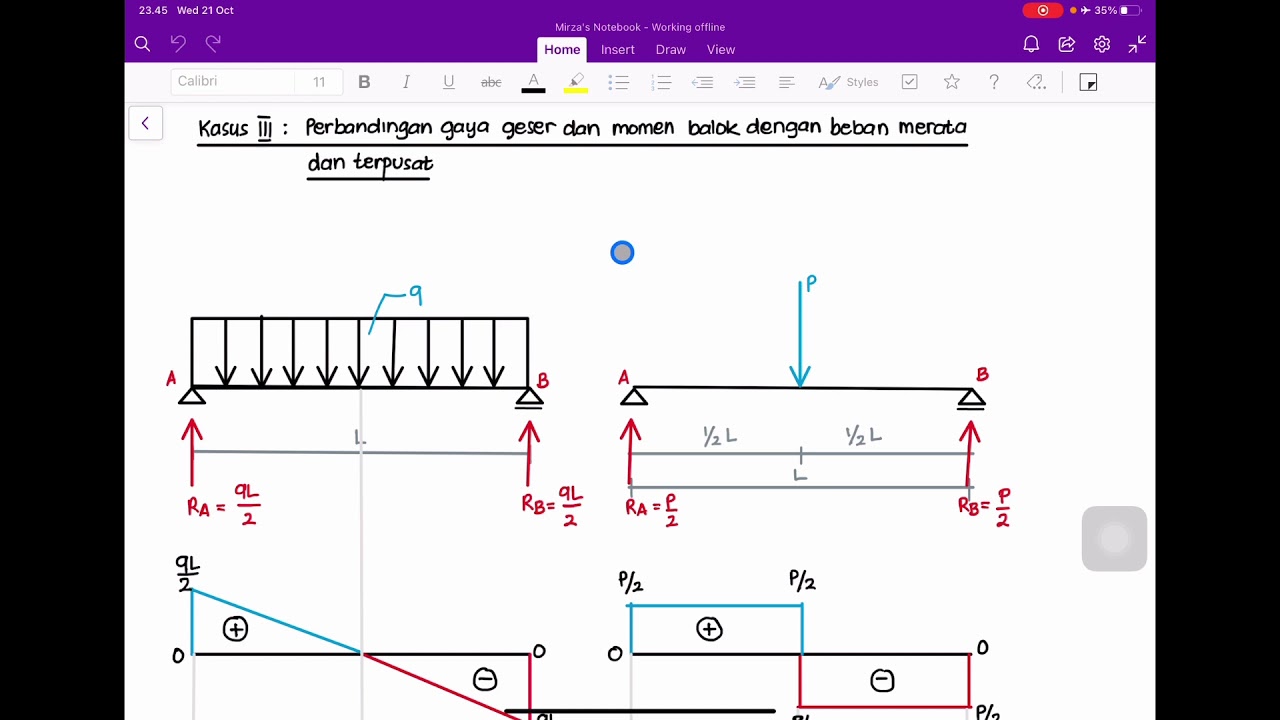
- ⚖️ The beam is subjected to a uniformly distributed load (UDL) of 10 kN/m over a length of 10 m and a concentrated load of 80 kN.
- 📊 The reaction at support A is calculated as 114 kN, and the reaction at support C is calculated as 66 kN.
- 🧮 For segment AB, the shear force equation is V_AB = 114 - 10x, and the bending moment equation is M_AB = 114x - 5x².
- 🧮 For segment BC, the shear force equation is V_BC = 34 - 10x, and the bending moment equation is M_BC = 34x + 160 - 5x².
- 📍 The shear at segment AB decreases linearly from 114 kN at x=0 to 94 kN at x=2 m.
- 📍 The shear at segment BC decreases from 14 kN at x=2 m to -66 kN at x=10 m.
- 📈 The bending moment reaches a maximum of 208 kNm at x=2 m and decreases to zero at the supports.
- 🖊️ The shear diagram is linear in each segment, and the moment diagram is parabolic and concave downward in each segment.
- 📌 Maximum bending moment occurs where the shear force equals zero, confirming the relationship between shear and moment.
- 🔍 The process includes breaking the beam into segments, calculating forces and moments for each, and using these to plot the diagrams accurately.
Q & A
What is the first step in analyzing the beam for shear and moment diagrams?
-The first step is to determine the external reactions at the supports by taking moments and summing vertical forces, considering clockwise moments as positive.
How is the reaction at point A (RA) calculated?
-RA is calculated by taking the summation of moments about point C, including contributions from the uniformly distributed load (UDL) and any concentrated loads, and setting the sum equal to zero. Solving the equation gives RA = 114 kN.
What is the value of the reaction at point C (RC), and how is it found?
-RC is found using the vertical force equilibrium equation: RA + RC - total load = 0. Substituting RA and total loads gives RC = 66 kN.
What are the loading segments considered in the analysis?
-The beam is divided into two segments: AB (from 0 to 2 m) and BC (from 2 to 10 m) to account for changes in loading, including concentrated and uniformly distributed loads.
What is the shear force equation for segment AB?
-The shear force for segment AB is V_AB = RA - w*x = 114 - 10x, where x is the distance from point A.
What is the bending moment equation for segment AB?
-The bending moment for segment AB is M_AB = RA*x - (w*x^2)/2 = 114x - 5x^2 (in kNm), where x is the distance from point A.
How is the shear force equation for segment BC formulated?
-For segment BC, the shear force is V_BC = RA - P - w*(x-2) = 34 - 10x, accounting for the reaction at A, the concentrated load of 80 kN, and the UDL beyond point B.
What is the bending moment equation for segment BC?
-The bending moment for segment BC is M_BC = 34x + 160 - 5x^2 (kNm), which considers the contribution of RA, the concentrated load at B, and the uniformly distributed load.
Where does the maximum bending moment occur and what is its value?
-The maximum bending moment occurs where the shear force crosses zero, which is at x = 2 m, with a value of 208 kNm.
What are the general shapes of the shear and moment diagrams for this beam?
-The shear diagram is linear, decreasing over both segments AB and BC, while the moment diagram is concave downward in both segments, peaking at the point where shear is zero.
Why is it important to divide the beam into segments for this analysis?
-Dividing the beam into segments allows accurate calculation of shear and moment equations for sections with different loading conditions, ensuring precise diagrams.
How does the uniformly distributed load affect the moment diagram?
-The UDL produces a parabolic moment curve because the moment at a point is the integral of the shear force, which varies linearly under UDL.
Outlines

This section is available to paid users only. Please upgrade to access this part.
Upgrade NowMindmap

This section is available to paid users only. Please upgrade to access this part.
Upgrade NowKeywords

This section is available to paid users only. Please upgrade to access this part.
Upgrade NowHighlights

This section is available to paid users only. Please upgrade to access this part.
Upgrade NowTranscripts

This section is available to paid users only. Please upgrade to access this part.
Upgrade NowBrowse More Related Video


5.0 / 5 (0 votes)