Física - Aula 112 - Curvas de aquecimento - Calorimetria
Summary
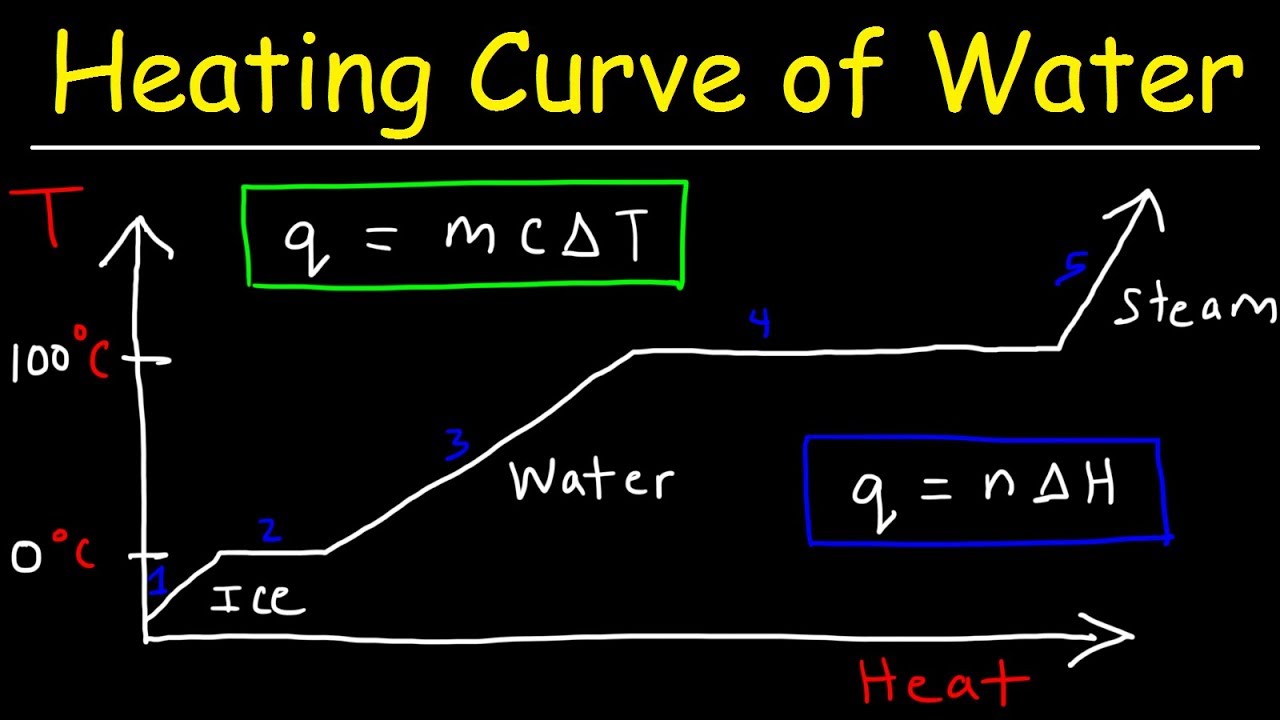
TLDRIn this educational video, the speaker explains the heating and cooling curve of water, illustrating the process as it changes from ice to vapor. Key stages include heating ice from -5°C to 0°C, melting ice, heating water to 100°C, evaporating water, and heating steam to 120°C. The speaker discusses the calculation of energy required for each phase change using specific formulas. The graph representing these changes has temperature on the y-axis and energy on the x-axis, highlighting both the temperature increase and phase transitions during the process.
Takeaways
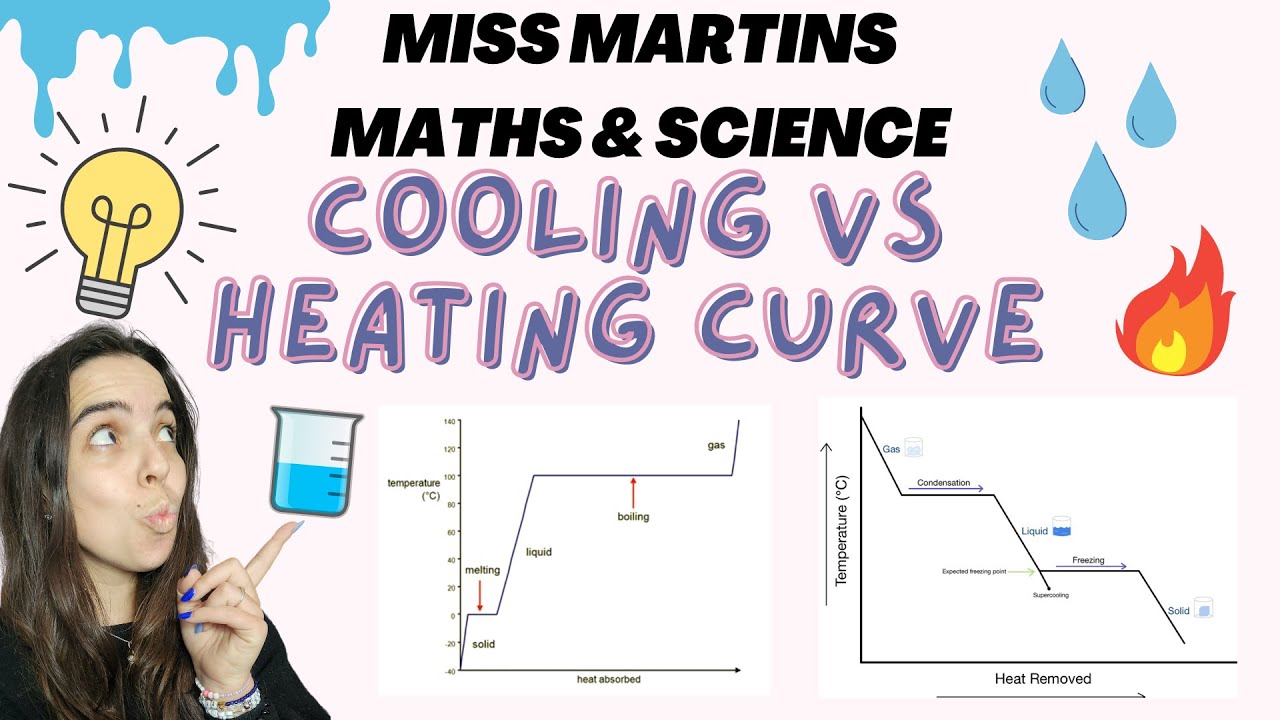
- 😀 The heating and cooling curve represents the transformation of a substance (e.g., ice) from solid to liquid to gas as it gains energy.
- 😀 The process involves five main stages: heating ice, melting ice, heating water, evaporating water, and heating steam.
- 😀 In the first step, energy is supplied to heat ice from -5°C to 0°C, increasing its temperature.
- 😀 The second step involves melting ice at 0°C, where the temperature stays constant while energy is used to break the bonds between water molecules.
- 😀 The third step involves heating water from 0°C to 100°C, which increases the temperature of the liquid.
- 😀 In the fourth step, water evaporates at 100°C, and the temperature stays constant while energy is used to convert the liquid into steam.
- 😀 The final step involves heating the steam from 100°C to 120°C, which increases the temperature of the gas.
- 😀 Energy calculations in each stage involve using specific formulas for temperature changes (using specific heat) and phase changes (using latent heat).
- 😀 Phase changes (e.g., melting and evaporation) occur at constant temperatures, requiring energy but not causing a temperature change.
- 😀 The heating and cooling curve is often simplified in exercises, showing only one phase change and the temperature changes within a phase.
- 😀 The graph created from this process consists of sloped lines for temperature changes and flat lines for phase transitions, representing energy input and temperature over time.
Q & A
What is the purpose of the heating and cooling curve described in the video?
-The heating and cooling curve illustrates the process of heating a substance, in this case, ice, and observing the temperature changes and phase transitions, such as melting and evaporation, as energy is supplied.
What are the five stages mentioned in the heating and cooling process of water?
-The five stages are: heating ice from -5°C to 0°C, melting the ice at 0°C, heating water from 0°C to 100°C, evaporating water at 100°C, and heating steam from 100°C to 120°C.
Why is energy supplied during the phase changes (melting and evaporation) but the temperature remains constant?
-During phase changes, such as melting and evaporation, the energy supplied is used to overcome the intermolecular forces, allowing the substance to change phase. As a result, the temperature remains constant during these transitions.
How does the heating curve graph represent temperature changes and phase transitions?
-The heating curve graph uses straight lines to represent temperature increases within a specific phase (solid, liquid, gas), and horizontal lines to represent phase transitions, where the temperature remains constant as energy is used for the phase change.
What is the significance of the 'plus seven' and 'Kimmel A' methods in the calculations?
-'Plus seven' is used when the temperature changes, while 'Kimmel A' is used during phase changes where temperature does not change but energy is still required to alter the phase.
How much energy is required to heat ice from -5°C to 0°C?
-It requires 25 calories to heat the ice from -5°C to 0°C.
How much energy is required to melt the ice at 0°C?
-It requires 800 calories to melt the ice at 0°C.
What is the total energy required to heat water from 0°C to 100°C?
-The total energy required to heat water from 0°C to 100°C is 1000 calories.
What happens when the water reaches 100°C and begins to evaporate?
-When the water reaches 100°C, it begins to evaporate, and the temperature remains constant during this phase change as the energy supplied is used to convert the water into steam.
How much energy is required to heat steam from 100°C to 120°C?
-It requires 100 calories to heat the steam from 100°C to 120°C.
Outlines

Cette section est réservée aux utilisateurs payants. Améliorez votre compte pour accéder à cette section.
Améliorer maintenantMindmap

Cette section est réservée aux utilisateurs payants. Améliorez votre compte pour accéder à cette section.
Améliorer maintenantKeywords

Cette section est réservée aux utilisateurs payants. Améliorez votre compte pour accéder à cette section.
Améliorer maintenantHighlights

Cette section est réservée aux utilisateurs payants. Améliorez votre compte pour accéder à cette section.
Améliorer maintenantTranscripts

Cette section est réservée aux utilisateurs payants. Améliorez votre compte pour accéder à cette section.
Améliorer maintenantVoir Plus de Vidéos Connexes
Heating Curve and Cooling Curve of Water - Enthalpy of Fusion & Vaporization
Cooling curve vs Heating curve Grade 10 Chemistry

Calorimetría: 2 problemas (sin cambio de estado) | Biofísica CBC | Física En Segundos (por Aníbal)

NECT Gr 10 Heating and Cooling Curve of Water

GCSE Physics - Specific Latent Heat #29

Heating Curve Grade 10: Kinetic Molecular Theory
5.0 / 5 (0 votes)
